

Question
22)The following data show the lengths of 56 telephone calls made by an executive during last week. A)Determine the number of classes, the class width,
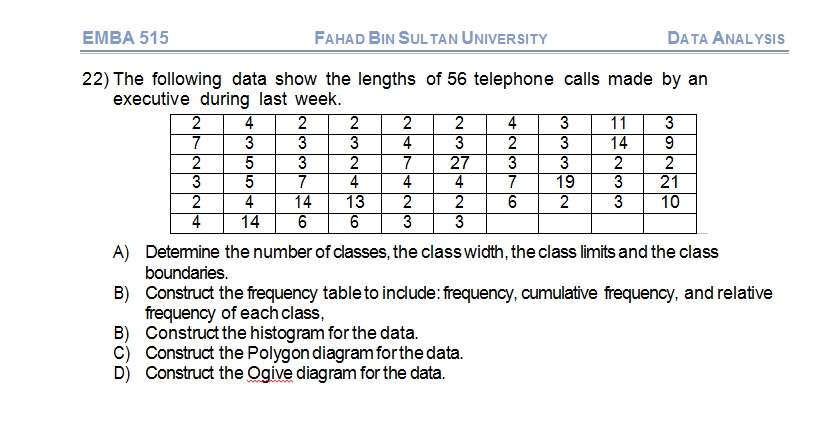
22)The following data show the lengths of 56 telephone calls made by an executive during last week.
A)Determine the number of classes, the class width, the class limits and the class boundaries.
B)Construct the frequency table to include: frequency, cumulative frequency, and relative frequency of each class,
B)Construct the histogram for the data.
C)Construct the Polygon diagram for the data.
Construct the Ogive diagram for the data
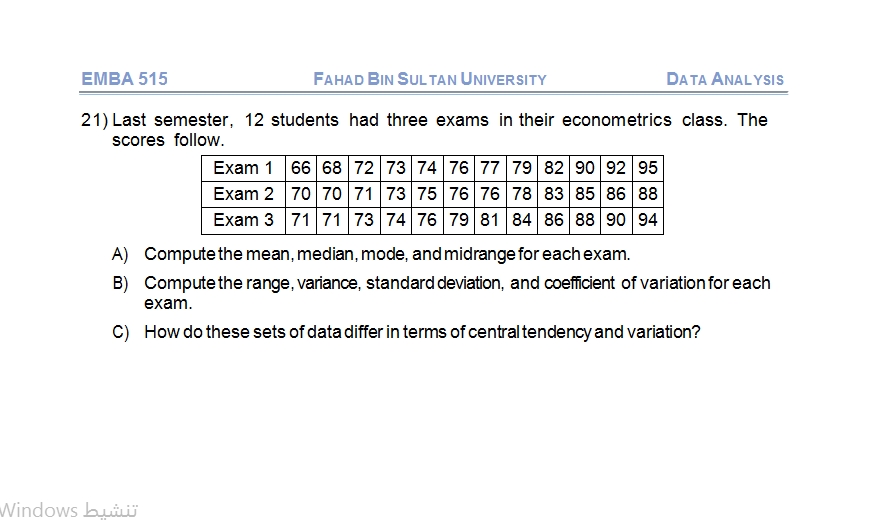
21) 1)The following data show the lengths of 56 telephone calls made by an executive during last week.
A)Compute the mean, median, mode, and midrange for each exam.
B)Compute the range, variance, standard deviation, and coefficient of variation for each exam.
C)How do these sets of data differ in terms of central tendency and variation?
Step by Step Solution
There are 3 Steps involved in it
Step: 1

Get Instant Access to Expert-Tailored Solutions
See step-by-step solutions with expert insights and AI powered tools for academic success
Step: 2

Step: 3
Ace Your Homework with AI
Get the answers you need in no time with our AI-driven, step-by-step assistance
Get Started
Introduction to Probability
Authors: Mark Daniel Ward, Ellen Gundlach
1st edition
716771098, 978-1319060893, 1319060897, 978-0716771098