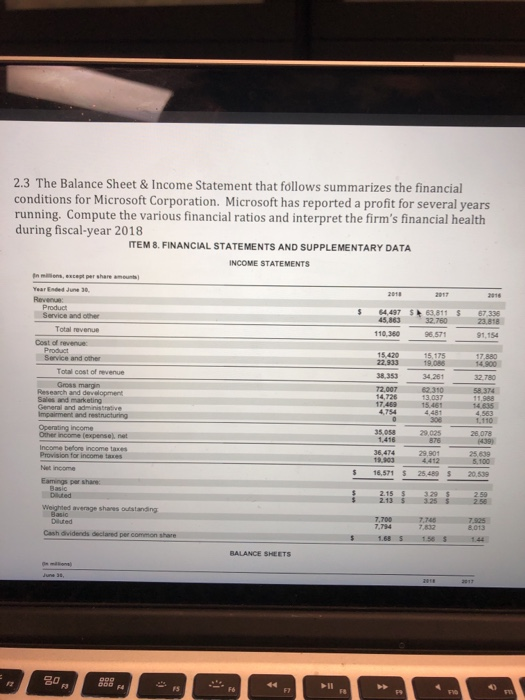
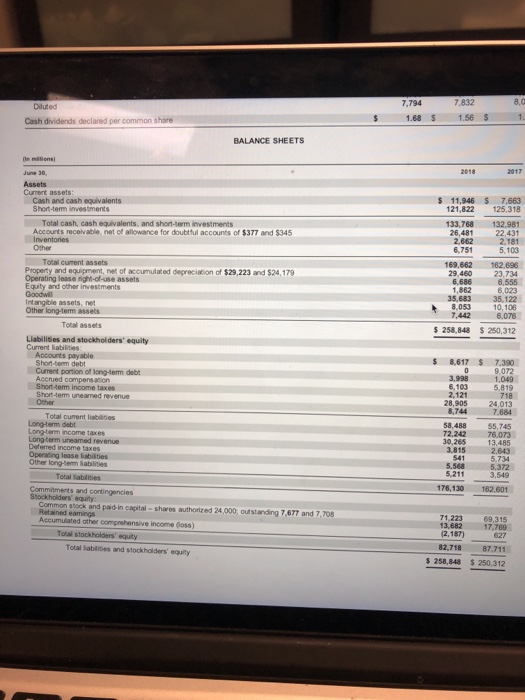
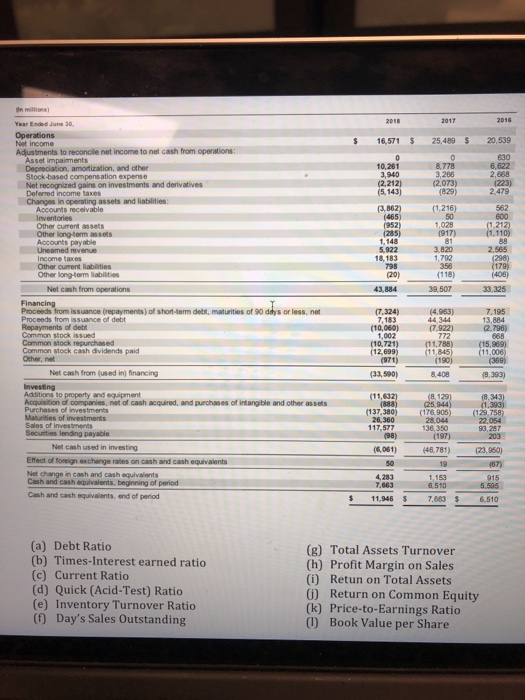
2.3 The Balance Sheet & Income Statement that follows summarizes the financial conditions for Microsoft Corporation. Microsoft has reported a profit for several years running. Compute the various financial ratios and interpret the firm's financial health during fiscal-year 2018 ITEM 8. FINANCIAL STATEMENTS AND SUPPLEMENTARY DATA INCOME STATEMENTS In miions,except per share amount) Year Ended June 30 4,497 $63,811 67.336 23,818 Service and other 45,863 Total revenue 110 380 96,571 91,154 Cost of revenue 15,420 22,933 19.086 38.353 72,007 14,726 Service and other Total cost of revenue 34,261 Research and development General and adminisa 110 Operating income 35.058 1416 25 639 5.100 Provision for income taxes 5 16,571 $ 25489 $ 20.539 Diauted 2.13 Basic 7,794 832 Cash dividends declared per 1.68 S 158 S1.44 BALANCE SHEETS 1 7,794 7,832 8,0 Diluted Cash dividends declared per common share 1.68 S 1.56 $ BALANCE SHEETS Assets Current assets Cash and cash equivalents Shon-temm investments 11,946 $ 7.663 121,822 125,318 Total cash, cash equivalents, and short-term investments Accounts receivable, net of allowance for doubtful accounts of $377 and $345 Inventories Other 133,768 132,981 22,431 2,181 5,103 26,481 2,662 6,751 Total cument assets 169,662 162,696 23,734 6,555 6,023 35,683 35,122 10,106 6,076 29,460 6,686 1,862 Operating lease right-of-use assets Equity and other investments Goodwill Intangible assets, net Other long-tem assets 8,053 7,442 6. Total assets s 258,848$ 250,312 Liabilisies and stockholders' equity Current liabilities Accounts payable Short-term debt Curment portion of lang-tem debt 8,617 7.390 9,072 3,9981,049 6,103 Short-tem income taxes 5,819 dem uneamed revenue 2,121718 24,013 7,684 Other 28,905 8,744 Total curent liabilities Long-term debt Long-term income taxes Long-term uneamed revenue 8,488 55,745 76.073 13,485 2.643 5,734 5.372 3,549 72,242 30,265 3,815 Operating lease iabilities 541 5,568 5,211 Total liablnies Commitments and contingencies 176,130 162.601 Common stock and paid-in capital- shares authorized 24,000 outstanding 7,677 and 7,708 Accumulated ather comprehensive income (loss) 71,223 13,68217.769 (2,187) 69,315 Total stockhokders' equty Total liabliies and stockholders equity 87.711 258,848 $ 250,312 82,718 2016 Year Ended June 30 Operations Adjustments to reconcile net income to net cash from operations 16,571 S 25,489 $ 20,539 630 6,622 2,868 10,261 Depreciation, amortization, and other Stockbased compens ation expense 3,940 (2,212) (5,143) 8,778 3,266 (2,073 on inves and derivatives (829) 2.479 in operating assets and liabilities: 3,862) (1,216) 562 Accounts receivable Inventories Other current assets Other longterm assets Accounts payable Uneamed revenue Income taxes Other cumrent liabilities Other long-term labilities (465) 1,148 5,922 18,183 798 20) 3,820 1,792 358 (118) 2,565 17 (406) Net cash from operations 43,884 9.507 33,325 Proceeds from issuance (repayments) of short-term debk, maturities of 90 days or less, net Proceeds from issuance of debt Repayments of debt (4,963) 44 344 7.195 13,884 (7.922) (2.796) 7.183 1,002 (12,699 (7,324) (10,060) (10,721) (971) Common stock repurchased Common stock cash dividends paid (11,788) (15, Other, net (190) Net cash from (used in) financing (33,590)84088.393) 8,393) Investing Additions to property and equipment Acquisition of companies, net of cash acquired, and purchases of intangible and other assets Purchases of investments (11,632) 137,380) (176 905) 28.044 26,360 117,577 22.054 136,350 93,287 23.950 (87) Securities lending payable Net cash used in investing (6,061) 46,781) Effect of foreign exchange rates on cash and cash equivalents 19 Net change in cash and cash equivalents Cash and cash equivalents, beginning of period 4,283 7,663 6.510 Cash and cash equivalents, end of period 11,946 7,683 6,510 (a) Debt Ratio (b) Times-Interest earned ratic (c) Current Ratio (d) Quick (Acid-Test) Ratio (e) Inventory Turnover Ratio (f) Day's Sales Outstanding (g) Total Assets Turnover (h) Profit Margin on Sales (i) Retun on Total Assets 0) Return on Common Equity (k) Price-to-Earnings Ratio (1) Book Value per Share