2&3rd pic are the same question as is the 4th and 5th . thanks in advance for your help, im lost
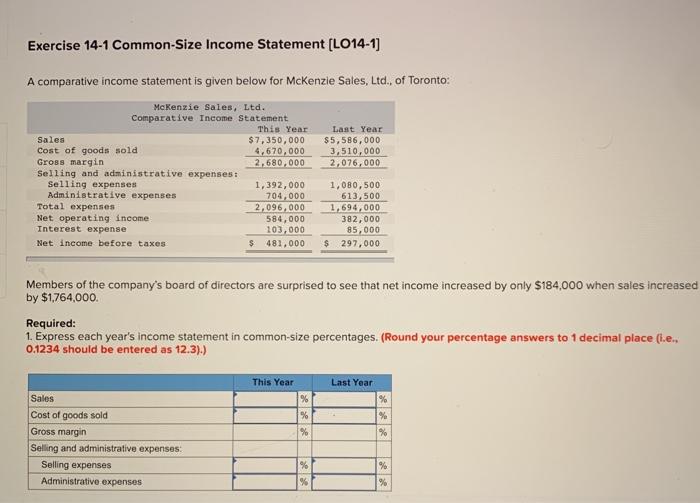
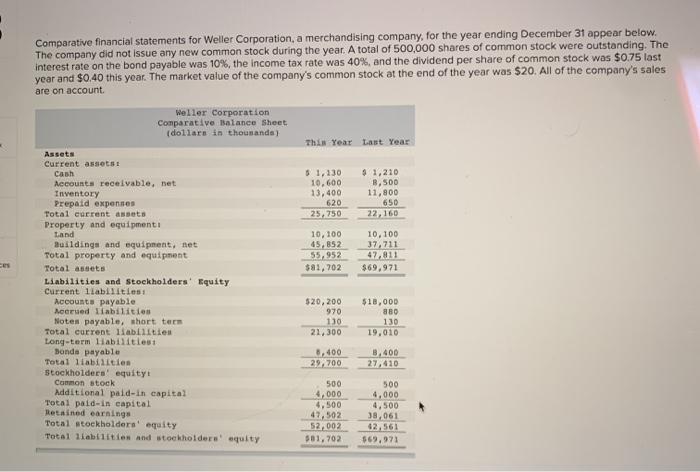
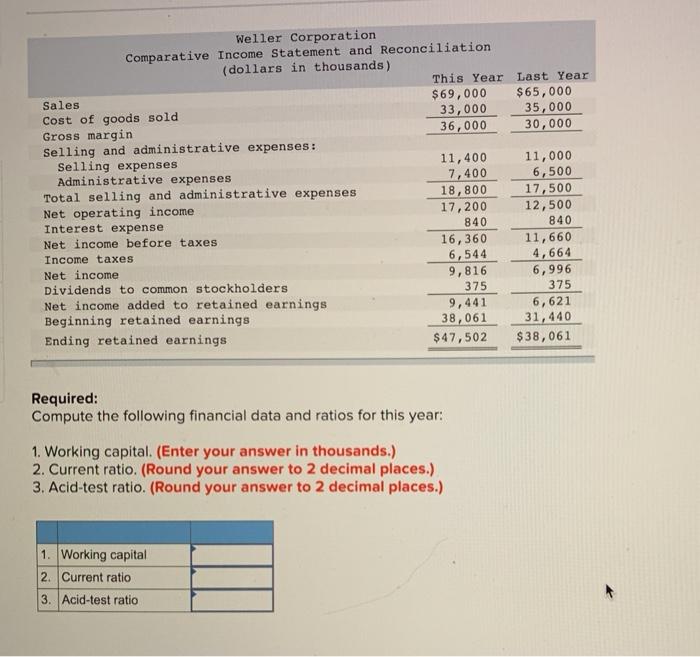
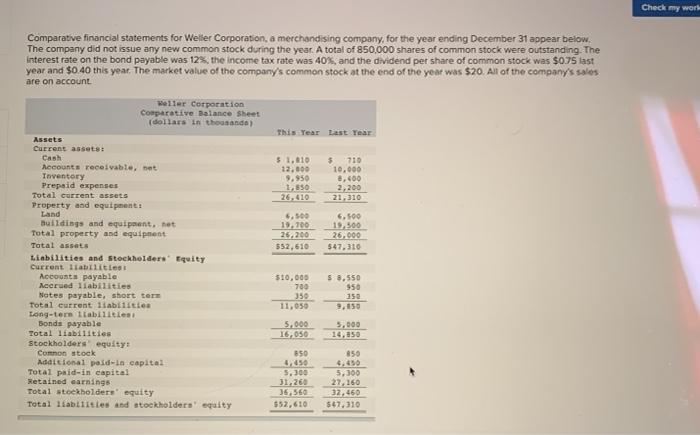
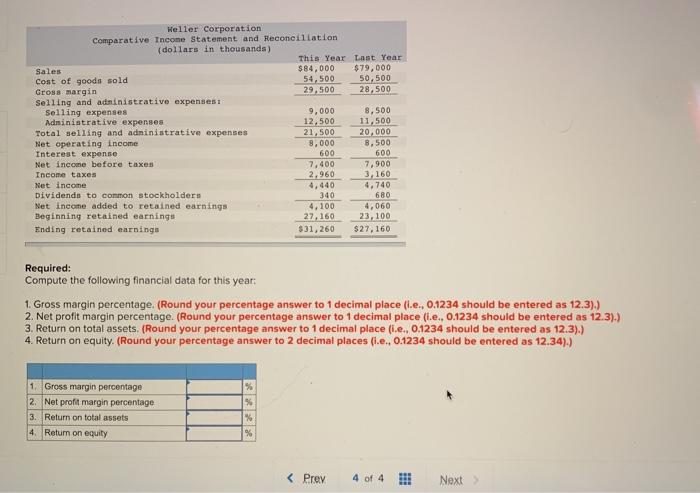
Exercise 14-1 Common-Size Income Statement (LO14-1) A comparative income statement is given below for McKenzie Sales, Ltd. of Toronto: Last Year $5,586,000 3.510,000 2,076,000 Mckenzie Sales, Ltd. Comparative Income Statement This Year Sales $7,350,000 Cost of goods sold 4.670,000 Gross margin 2,680,000 Selling and administrative expenses Selling expenses 1,392,000 Administrative expenses 704,000 Total expenses 2.096.000 Net operating income 584,000 Interest expense 103,000 Net income before taxes $ 481,000 1,080,500 613,500 1,694,000 382,000 85,000 $ 297,000 Members of the company's board of directors are surprised to see that net income increased by only $184,000 when sales increased by $1764,000 Required: 1. Express each year's income statement in common-size percentages. (Round your percentage answers to 1 decimal place (t.e., 0.1234 should be entered as 12.3).) This Year % Last Year % % % % Sales Cost of goods sold Gross margin Selling and administrative expenses Selling expenses Administrative expenses % % % % Comparative financial statements for Weller Corporation, a merchandising company, for the year ending December 31 appear below. The company did not issue any new common stock during the year. A total of 500,000 shares of common stock were outstanding. The interest rate on the bond payable was 10%, the income tax rate was 40%, and the dividend per share of common stock was $0.75 last year and $0.40 this year. The market value of the company's common stock at the end of the year was $20. All of the company's sales are on account Weller Corporation Comparative Balance Sheet (dollars in thousands) This Year Last Year $1,130 10.600 13, 400 620 25,750 6 1,210 B.500 11,800 650 22,160 10,100 65.852 55,952 $81, 702 10.100 37.711 47.811 $69,971 Assets Current assets Cash Accounts receivable. net Inventory Prepaid expenses Total current assets Property and equipmenti Land Buildings and equipment, net Total property and equipment Total assets Liabilities and Stockholders' Equity Current liabilities: Accounts payable Norued liabilities Notes payable, short teen Total current liabilities Long-term liabilities: Bonds payable Total liabilities stockholders' equity Common stock Additional paid-in capital Total paid-in capital Retained earnings Total stockholders' equity Total liabilities and stockholders' equity 520,200 970 $18,000 880 130 21,300 19.010 8.400 29, 700 3,400 27,410 500 4,000 4,500 47,502 52.002 501, 702 500 4,000 4,500 38,061 42,561 $69.971 Last Year $65,000 35,000 30,000 Weller Corporation Comparative Income Statement and Reconciliation (dollars in thousands) This Year Sales $69,000 Cost of goods sold 33,000 Gross margin 36,000 Selling and administrative expenses: Selling expenses 11,400 Administrative expenses 7,400 Total selling and administrative expenses 18,800 Net operating income 17,200 Interest expense 840 Net income before taxes 16,360 Income taxes 6,544 Net income 9,816 Dividends to common stockholders 375 Net income added to retained earnings 9,441 Beginning retained earnings 38,061 Ending retained earnings $ 47,502 11,000 6,500 17,500 12,500 840 11,660 4,664 6,996 375 6,621 31,440 $38,061 Required: Compute the following financial data and ratios for this year: 1. Working capital. (Enter your answer in thousands.) 2. Current ratio. (Round your answer to 2 decimal places.) 3. Acid-test ratio. (Round your answer to 2 decimal places.) 1. Working capital 2. Current ratio 3. Acid-test ratio Check my worlu Comparative financial statements for Weller Corporation, a merchandising company, for the year ending December 31 appear below. The company did not issue any new common stock during the year. A total of 850.000 shares of common stock were outstanding. The interest rate on the bond payable was 12%, the income tax rate was 40%, and the dividend per share of common stock was $0.75 last year and $0.40 this year. The market value of the company's common stock at the end of the year was $20. All of the company's sales are on account Welter Corporation Comparative Balance Sheet (dollars in thousands) This Year Last Year 5 1.810 12.000 9.950 1.550 26.410 $ 710 10.000 8,400 2,200 21.310 5.500 19.700 26.200 552,610 6.500 19.500 26.000 547.310 Assets Current assets: Cash Accounts receivable, et Inventory Prepaid expenses Total current assets Property and equipment Land Buildings and equipment, tot Total property and equipment Total assets Liabilities and stockholders' Equity current liabilities Accounts payable Accrued 11abilities Notes payable, short ter Total current liabilities Long-ter abilities: Bonds payable Total liabilities stockholders equity Comon stock Additional paid-in capital Total paid-in capital Retained earnings Total stockholders' equity Total liabilities and stockholders' equity 510,000 700 $ 8,550 950 250 9.150 11,050 5.000 16,050 5.000 14,850 850 5.300 31.260 35560 $52,610 850 6.690 5,300 27,160 32, 450 $47.310 Heller Corporation Comparative Income Statement and Reconciliation (dollars in thousands) This Year Last Year Sales $84,000 $79,000 Cost of goods sold 54,500 50.500 Gross margin 29.500 28,500 Selling and administrative expenses Selling expenses 9,000 8,500 Administrative expenses 12,500 11,500 Total selling and administrative expenses 21,500 20.000 Net operating income 8,000 8.500 Interest expense 600 600 Net income before taxes 7,400 7,900 Income taxes 2.960 3,160 Net income 4.440 4.740 Dividends to common stockholders 340 680 Net income added to retained earnings 4,100 4,060 Beginning retained earnings 27,160 23,100 Ending retained earnings $31,260 $27, 160 Required: Compute the following financial data for this year: 1. Gross margin percentage. (Round your percentage answer to 1 decimal place (i.e., 0.1234 should be entered as 12.3).) 2. Net profit margin percentage. (Round your percentage answer to 1 decimal place (ie, 0.1234 should be entered as 12.3).) 3. Return on total assets. (Round your percentage answer to 1 decimal place (i... 0.1234 should be entered as 12.3).) 4. Return on equity. (Round your percentage answer to 2 decimal places (i.e., 0.1234 should be entered as 12.34):) 1. Gross margin percentage 2. Net profit margin percentage 3. Return on total assets 4. Return on equity %