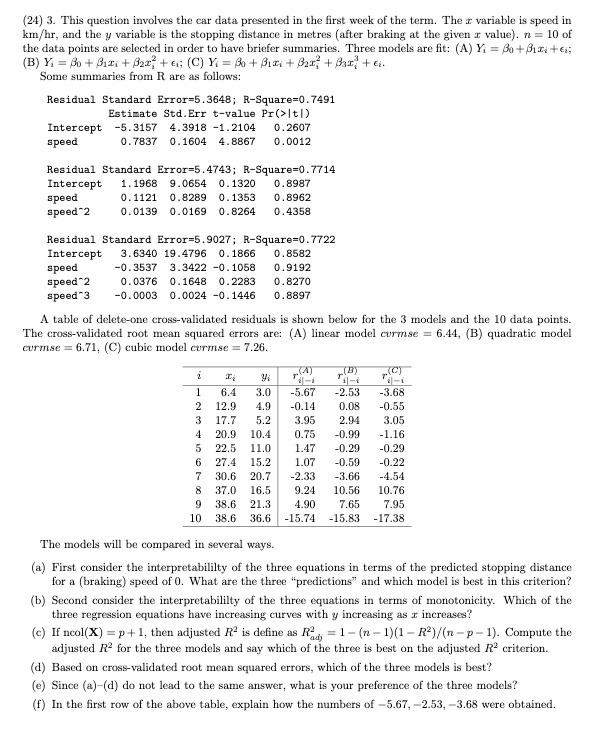
(24) 3. This question involves the car data presented in the first week of the term. The r variable is speed in km/hr, and the y variable is the stopping distance in metres (after braking at the given a value). n = 10 of the data points are selected in order to have briefer summaries. Three models are fit: (A) Yi = 3 + pinter; (B) Yi = bo+ Pirit perf + o; (C) Y = po+ Pini+ Phr; + Bar, ta. Some summaries from R are as follows: Residual Standard Error=5.3648; R-Square=0. 7491 Estimate Std. Err t-value Pr(>|+[) Intercept -5.3157 4.3918 -1.2104 0.2607 speed 0.7837 0.1604 4.8867 0. 0012 Residual Standard Error=5. 4743; R-Square=0. 7714 Intercept 1. 1968 9.0654 0. 1320 0. 8987 speed 0. 1121 0.8289 0. 1353 0. 8962 speed*2 0. 0139 0.0169 0.8264 0. 4358 Residual Standard Error=5.9027; R-Square=0.7722 Intercept 3. 6340 19.4796 0. 1866 0. 8582 speed -0. 3537 3.3422 -0. 1058 0. 9192 speed-2 0.0376 0.1648 0.2283 0. 8270 speed*3 -0. 0003 0.0024 -0.1446 0. 8897 A table of delete-one cross-validated residuals is shown below for the 3 models and the 10 data points. The cross-validated root mean squared errors are: (A) linear model cormse = 6.44, (B) quadratic model cormse = 6.71, (C) cubic model cormse = 7.26. i 1 6.4 3.0 -5.67 -2.53 -3.68 2 12.9 4.9 .0.14 0.08 -0.55 3 17.7 5.2 3.95 2.94 3.05 4 20.9 10.4 0.75 -0.99 -1.16 5 22.5 11.0 1.47 -0.29 -0.29 6 27.4 15.2 1.07 -0.59 -0.22 7 30.6 20.7 -2.33 -3.66 -4.54 37.0 16.5 9.24 10.56 10.76 38.6 21.3 4.90 7.65 7.95 10 38.6 36.6 -15.74 -15.83 -17.38 The models will be compared in several ways. (a) First consider the interpretabililty of the three equations in terms of the predicted stopping distance for a (braking) speed of 0. What are the three "predictions" and which model is best in this criterion? (b) Second consider the interpretabililty of the three equations in terms of monotonicity. Which of the three regression equations have increasing curves with y increasing as r increases? (c) If ncol(X) = p + 1, then adjusted R' is define as Ra =1-(n - 1)(1 - R')/(n-p-1). Compute the adjusted R" for the three models and say which of the three is best on the adjusted R' criterion. (d) Based on cross-validated root mean squared errors, which of the three models is best? (e) Since (a)-(d) do not lead to the same answer, what is your preference of the three models? (f) In the first row of the above table, explain how the numbers of -5.67, -2.53, -3.68 were obtained