Answered step by step
Verified Expert Solution
Link Copied!

Question

1 Approved Answer

25 20 15 10 5 10 15 20 25 What does the diagram above represent? (O Lines that are intersecting a parabola at two points.
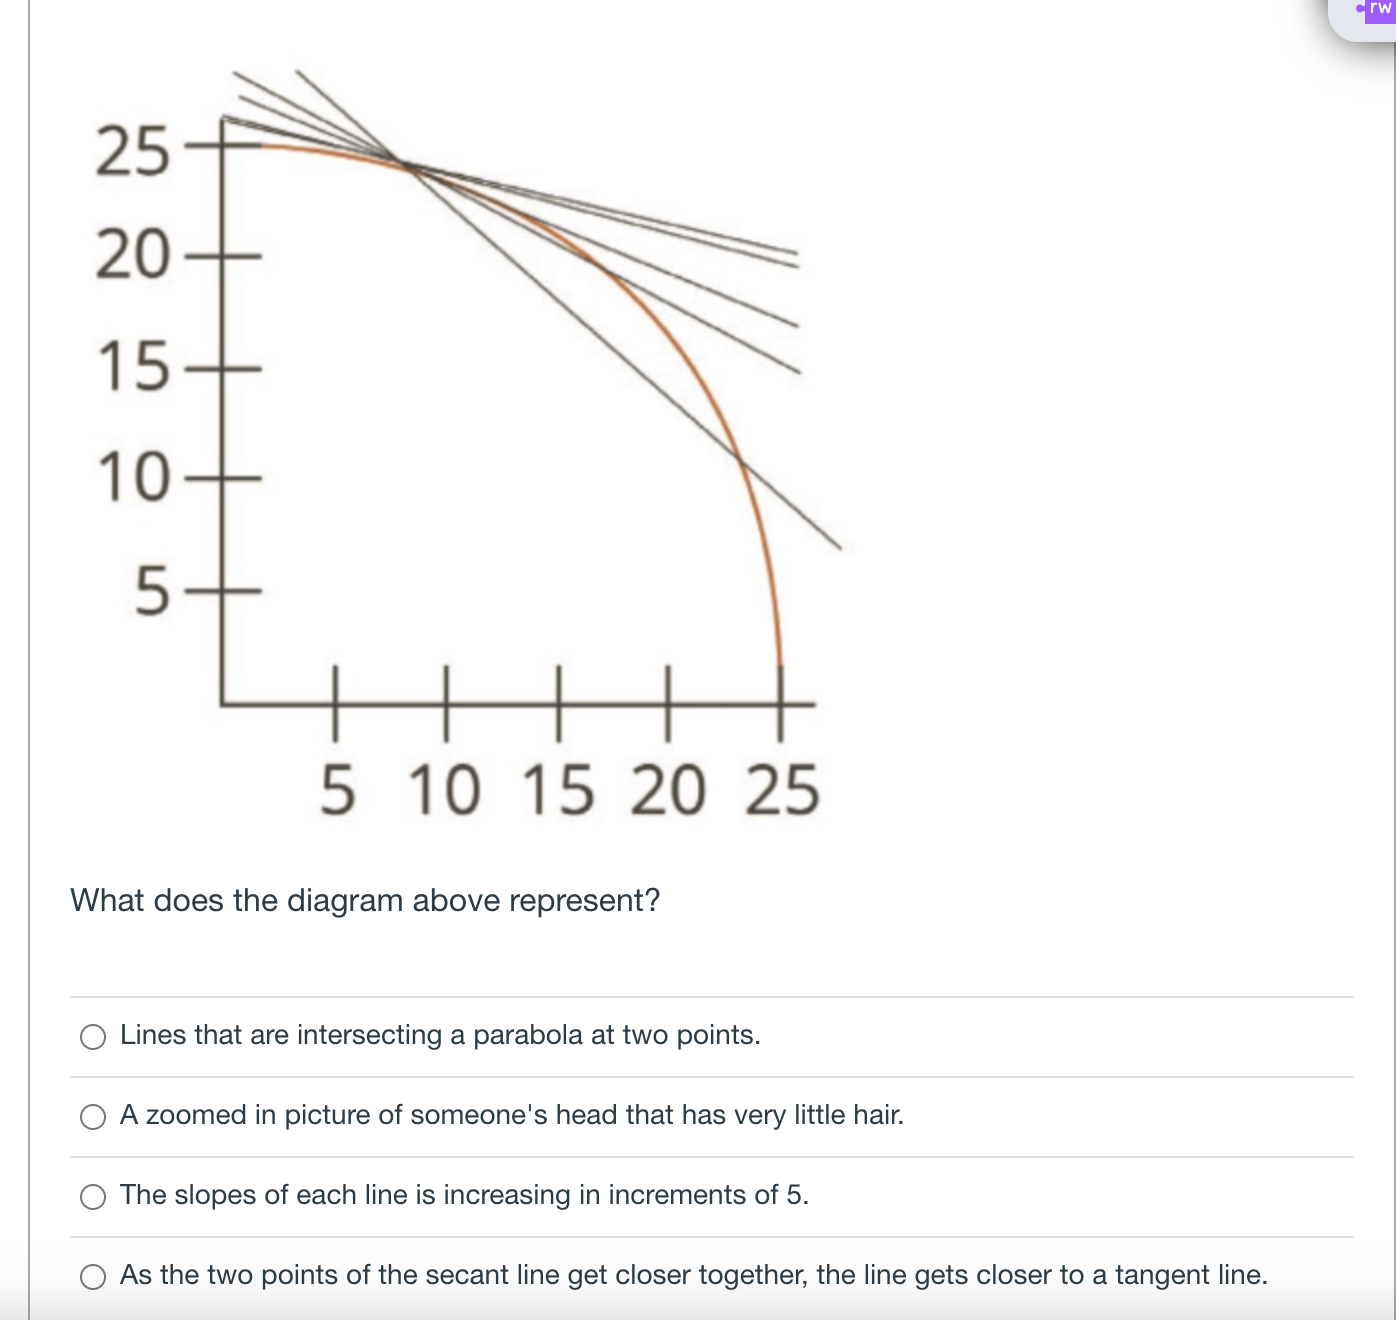
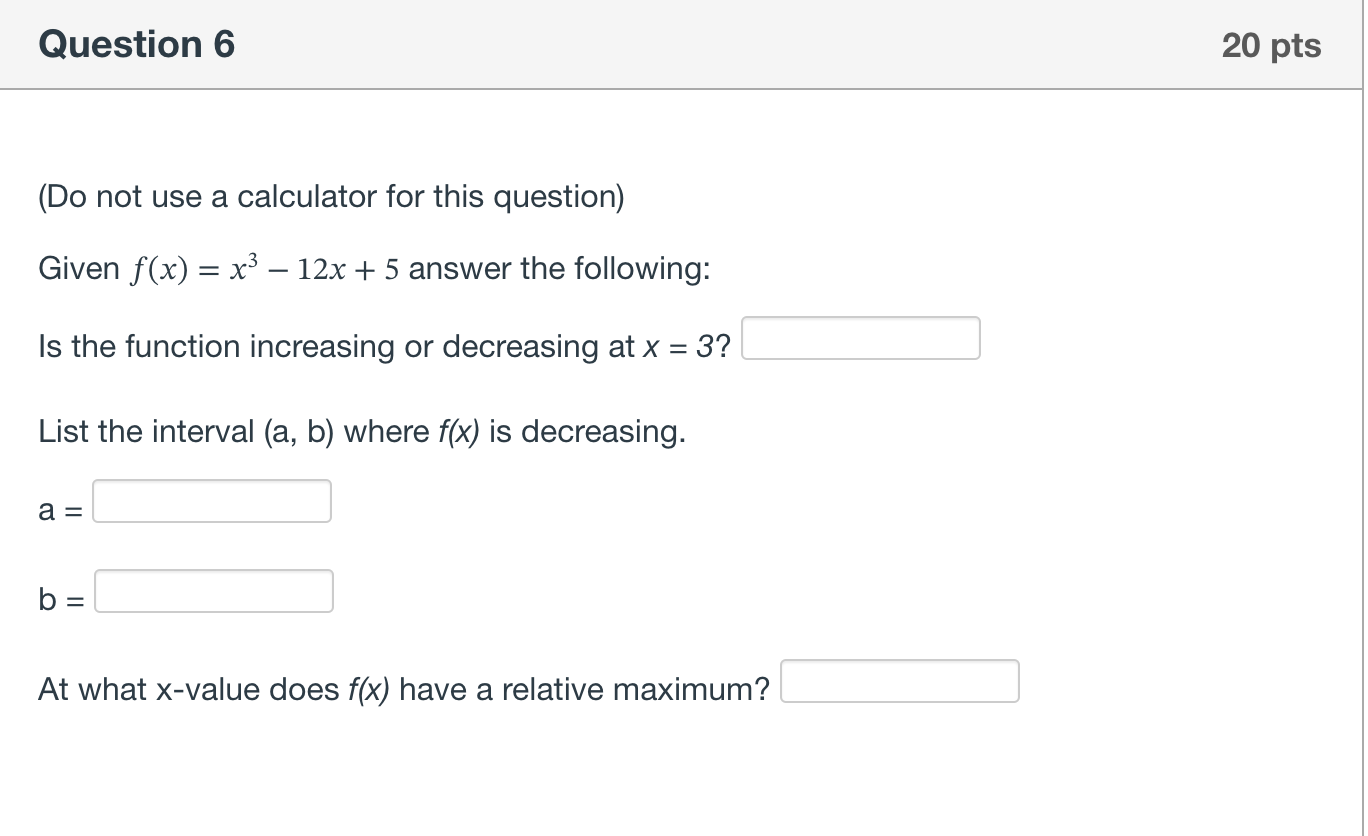
image text in transcribedimage text in transcribed
25 20 15 10 5 10 15 20 25 What does the diagram above represent? (O Lines that are intersecting a parabola at two points. (O A zoomed in picture of someone's head that has very little hair. (O The slopes of each line is increasing in increments of 5. (O As the two points of the secant line get closer together, the line gets closer to a tangent line. Question 6 20 pts (Do not use a calculator for this question) Given f(x) = x* 12x + 5 answer the following: Is the function increasing or decreasing at x = 37 List the interval (a, b) where f(x) is decreasing. a= b= At what x-value does f(x) have a relative maximum

Step by Step Solution

There are 3 Steps involved in it

Step: 1

blur-text-image

Get Instant Access to Expert-Tailored Solutions

See step-by-step solutions with expert insights and AI powered tools for academic success

Step: 2

blur-text-image

Step: 3

blur-text-image

Ace Your Homework with AI

Get the answers you need in no time with our AI-driven, step-by-step assistance

Get Started

Recommended Textbook for

Essentials of Business Analytics

Authors: Jeffrey D. Camm, James J. Cochran, Michael J. Fry, Jeffrey W. Ohlmann, David R. Anderson

2nd edition

1305627733, 978-1305861817, 1305861817, 978-0357688960, 978-1305627734

More Books

Students also viewed these Mathematics questions

Question

2 What do you think of the brand name Danish Klassic?

Answered: 1 week ago