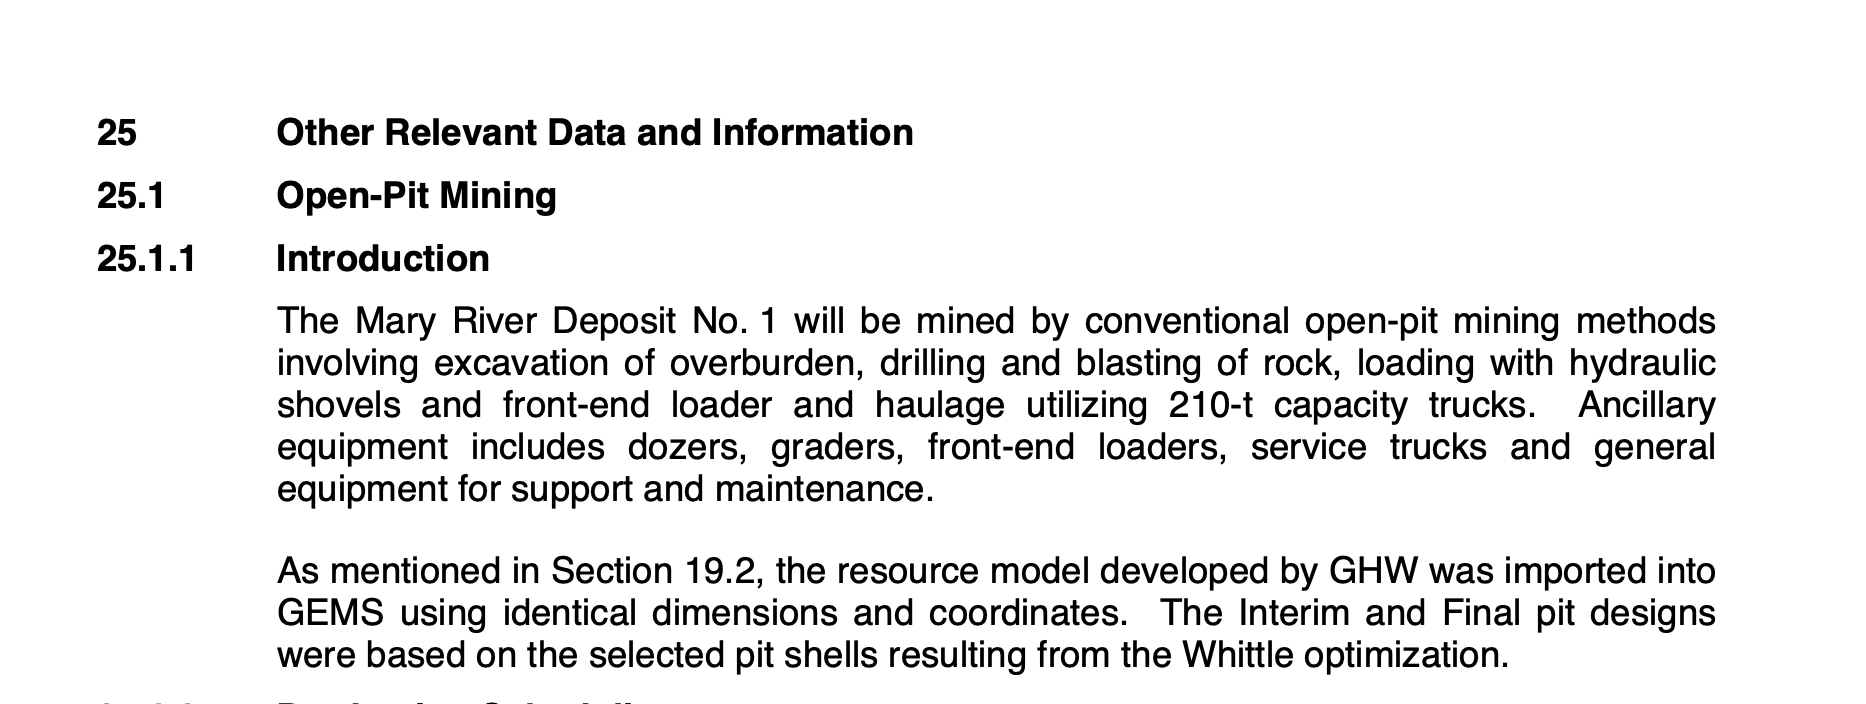
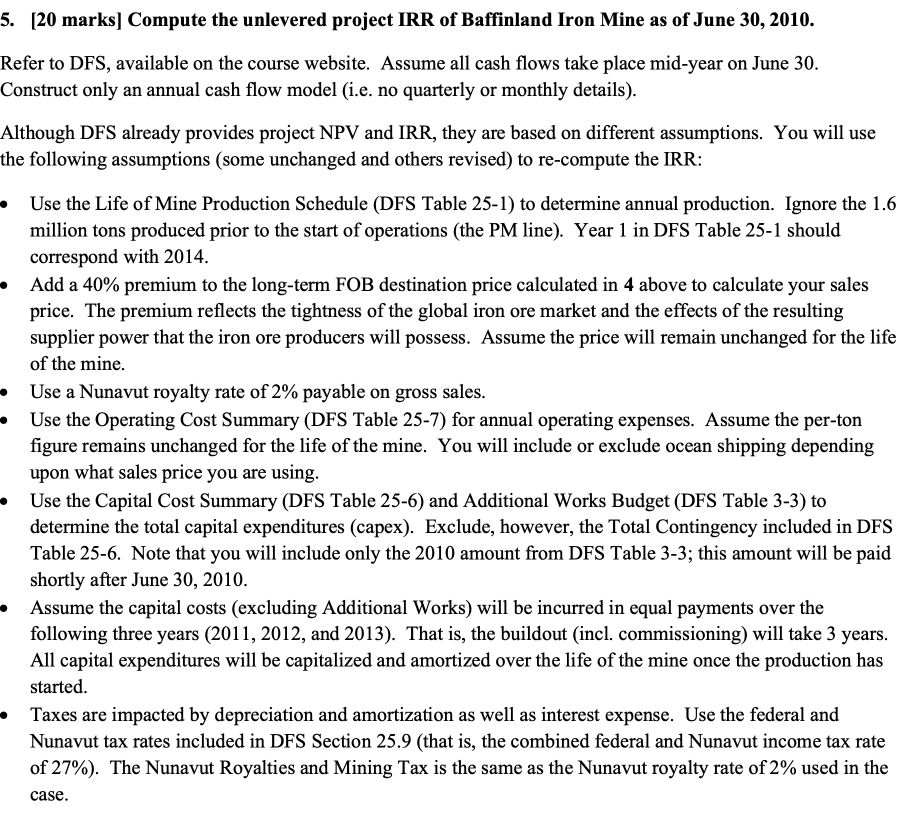
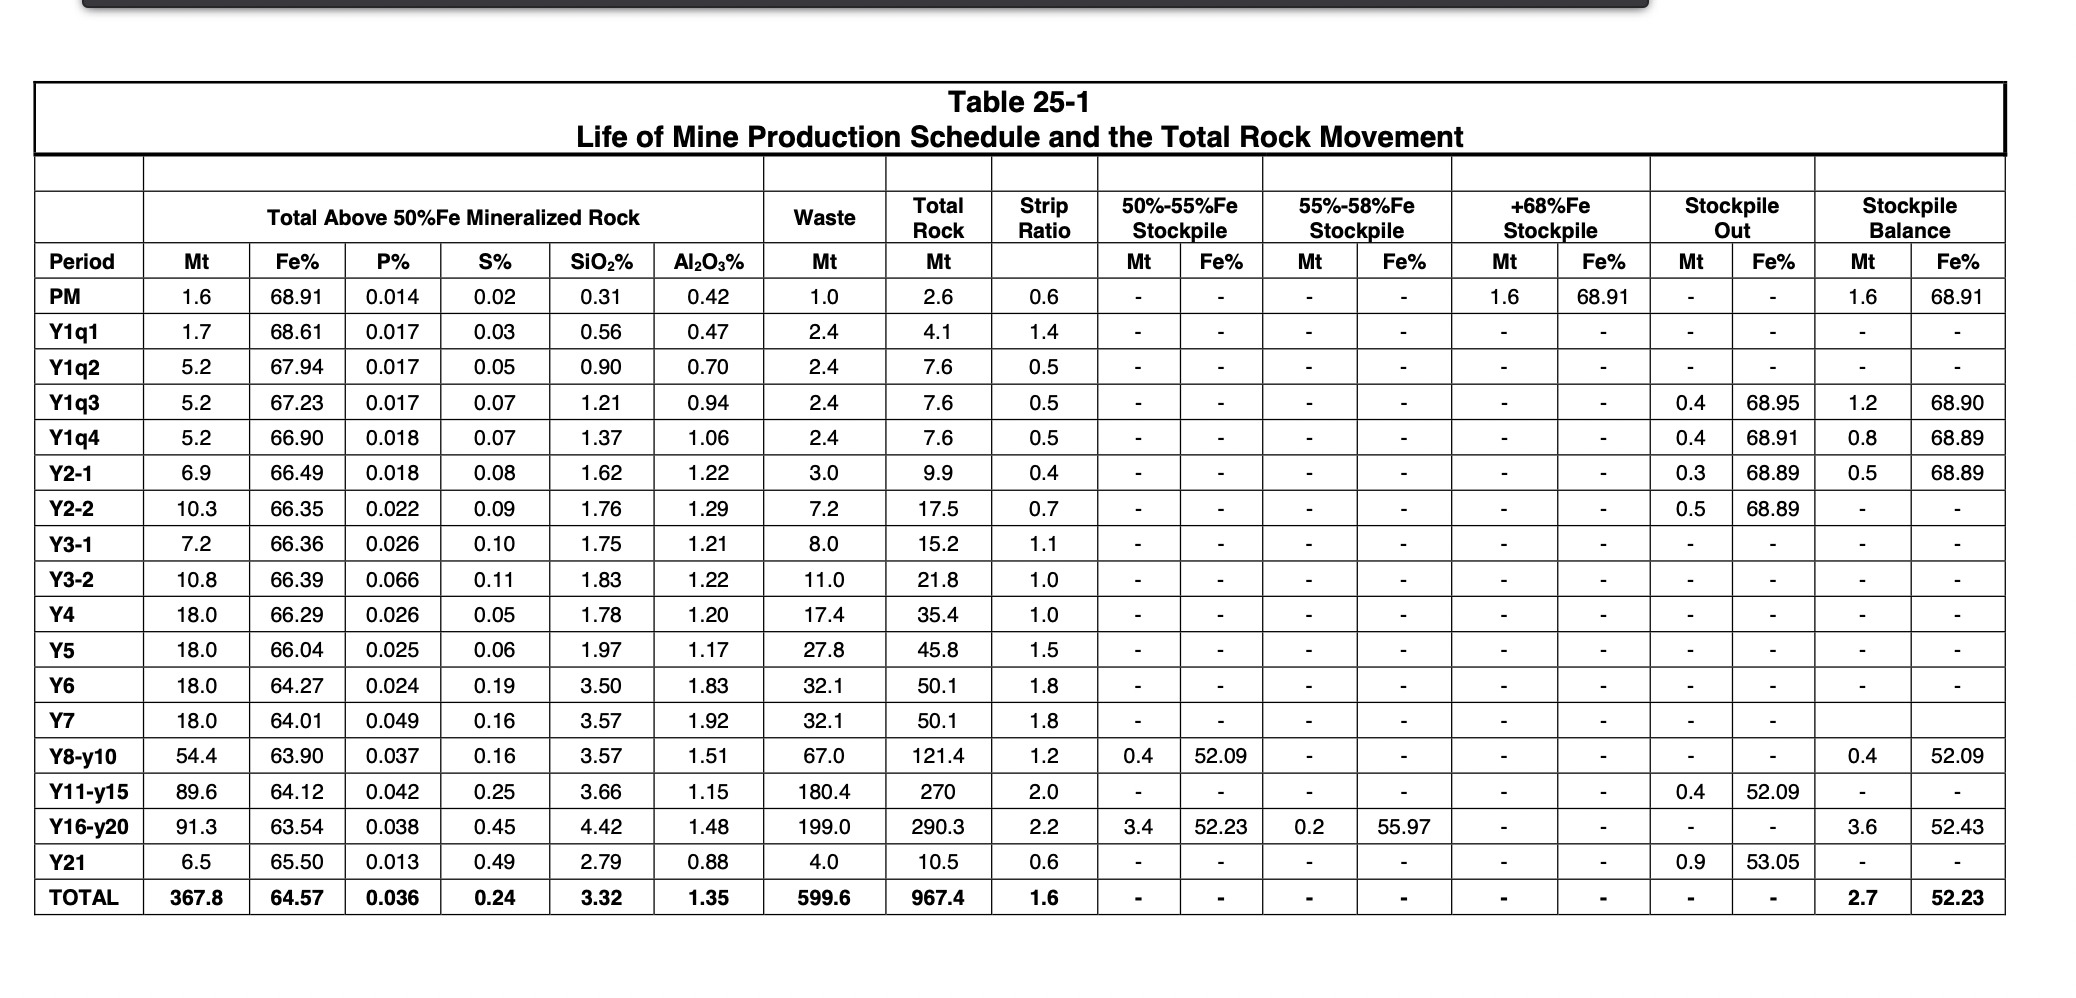
25 Other Relevant Data and Information 25.1 Open-Pit Mining 25.1.1 Introduction The Mary River Deposit No. 1 will be mined by conventional open-pit mining methods involving excavation of overburden, drilling and blasting of rock, loading with hydraulic shovels and front-end loader and haulage utilizing 210-t capacity trucks. Ancillary equipment includes dozers, graders, front-end loaders, service trucks and general equipment for support and maintenance. As mentioned in Section 19.2, the resource model developed by GHW was imported into GEMS using identical dimensions and coordinates. The Interim and Final pit designs were based on the selected pit shells resulting from the Whittle optimization. 5. [20 marks] Compute the unlevered project IRR of Baffinland Iron Mine as of June 30, 2010. Refer to DFS, available on the course website. Assume all cash flows take place mid-year on June 30 . Construct only an annual cash flow model (i.e. no quarterly or monthly details). Although DFS already provides project NPV and IRR, they are based on different assumptions. You will use the following assumptions (some unchanged and others revised) to re-compute the IRR: Use the Life of Mine Production Schedule (DFS Table 25-1) to determine annual production. Ignore the 1.6 million tons produced prior to the start of operations (the PM line). Year 1 in DFS Table 25-1 should correspond with 2014. - Add a 40% premium to the long-term FOB destination price calculated in 4 above to calculate your sales price. The premium reflects the tightness of the global iron ore market and the effects of the resulting supplier power that the iron ore producers will possess. Assume the price will remain unchanged for the life of the mine. - Use a Nunavut royalty rate of 2% payable on gross sales. - Use the Operating Cost Summary (DFS Table 25-7) for annual operating expenses. Assume the per-ton figure remains unchanged for the life of the mine. You will include or exclude ocean shipping depending upon what sales price you are using. Use the Capital Cost Summary (DFS Table 25-6) and Additional Works Budget (DFS Table 3-3) to determine the total capital expenditures (capex). Exclude, however, the Total Contingency included in DFS Table 25-6. Note that you will include only the 2010 amount from DFS Table 3-3; this amount will be paid shortly after June 30,2010. - Assume the capital costs (excluding Additional Works) will be incurred in equal payments over the following three years (2011, 2012, and 2013). That is, the buildout (incl. commissioning) will take 3 years. All capital expenditures will be capitalized and amortized over the life of the mine once the production has started. Taxes are impacted by depreciation and amortization as well as interest expense. Use the federal and Nunavut tax rates included in DFS Section 25.9 (that is, the combined federal and Nunavut income tax rate of 27% ). The Nunavut Royalties and Mining Tax is the same as the Nunavut royalty rate of 2% used in the case. Table 25-6 Mary River Iron Ore Project Capital Cost Summary \begin{tabular}{lr} Project Area Description & Cost \\ Direct Costs & ( CAD 000 000) \\ Processing Plant & 609.8 \\ Mining & 22.8 \\ Infrastructure at Mary River Mine & 256.3 \\ Infrastructure at Steensby Inlet Port & 282.8 \\ Steensby Port Facilities & 148.4 \\ Railroad & 1,214.8 \\ Total Direct Costs & 2,534.9 \\ Indirect Costs & \\ Project Indirect Costs & 987.9 \\ Owner Costs & 85.7 \\ Royalties (Gravel) & 28.7 \\ Subtotal Direct and Indirect & 3,637.2 \\ Total Contingency & 437.8 \\ TOTAL PROJECT CAPITAL COST & 4,075.0 \\ \hline \end{tabular} Table 25-7 Operating Cost Summary CAD/dmt Mining 4.08 Processing 4.89 Railroad 1.45 G \& A 4.19 Subtotal 14.62 Ocean Shipping* 30.25 TOTAL 44.87 Table 25-9 Annual Cash Flow (CAD x '000 000) The following activities are included in the above budget