Answered step by step
Verified Expert Solution
Question
1 Approved Answer
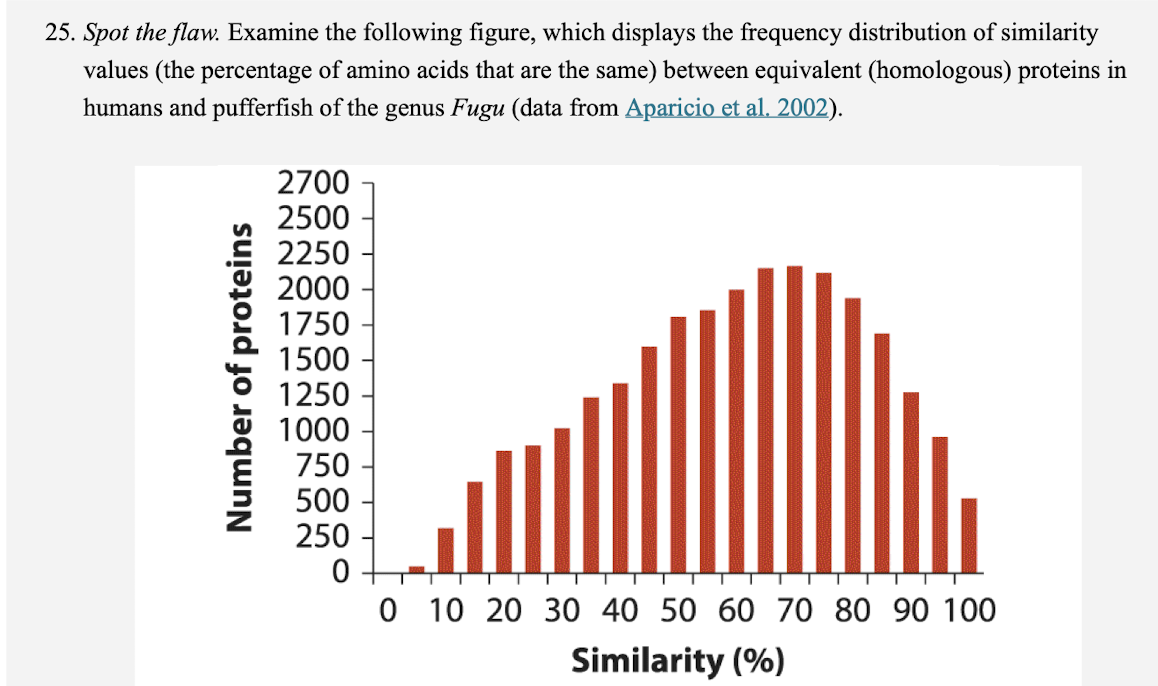
25. Spot the flaw. Examine the following figure, which displays the frequency distribution of similarity values (the percentage of amino acids that are the


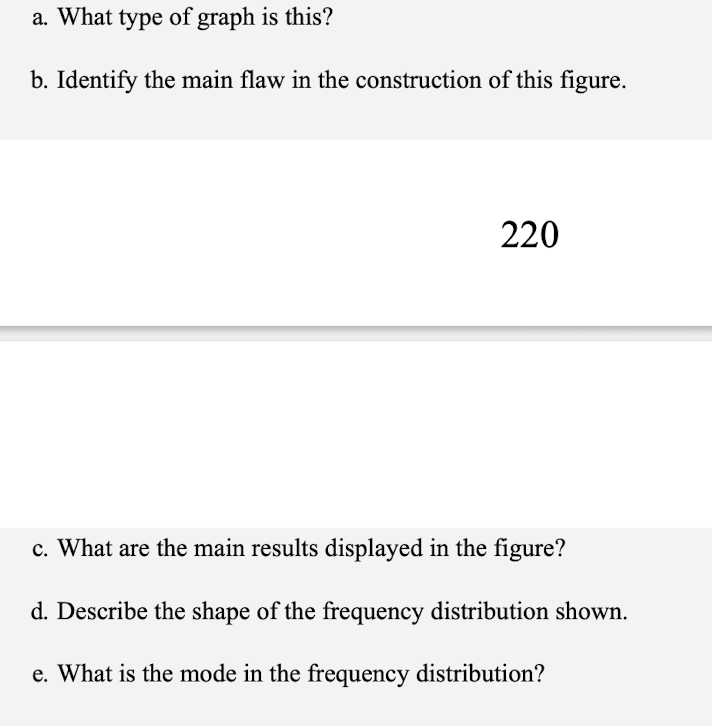
25. Spot the flaw. Examine the following figure, which displays the frequency distribution of similarity values (the percentage of amino acids that are the same) between equivalent (homologous) proteins in humans and pufferfish of the genus Fugu (data from Aparicio et al. 2002). Number of proteins 2700 2500 2250 2000 1750 1500 1250 1000 750 500 250 0 T T T TT 0 10 20 30 40 50 60 70 80 90 100 Similarity (%) a. What type of graph is this? b. Identify the main flaw in the construction of this figure. 220 c. What are the main results displayed in the figure? d. Describe the shape of the frequency distribution shown. e. What is the mode in the frequency distribution?
Step by Step Solution
There are 3 Steps involved in it
Step: 1
Solutions Answer A What is the variable Similarity in percentages B State whether the variable i...
Get Instant Access to Expert-Tailored Solutions
See step-by-step solutions with expert insights and AI powered tools for academic success
Step: 2

Step: 3

Ace Your Homework with AI
Get the answers you need in no time with our AI-driven, step-by-step assistance
Get Started


