

Answered step by step
Verified Expert Solution
Question
1 Approved Answer
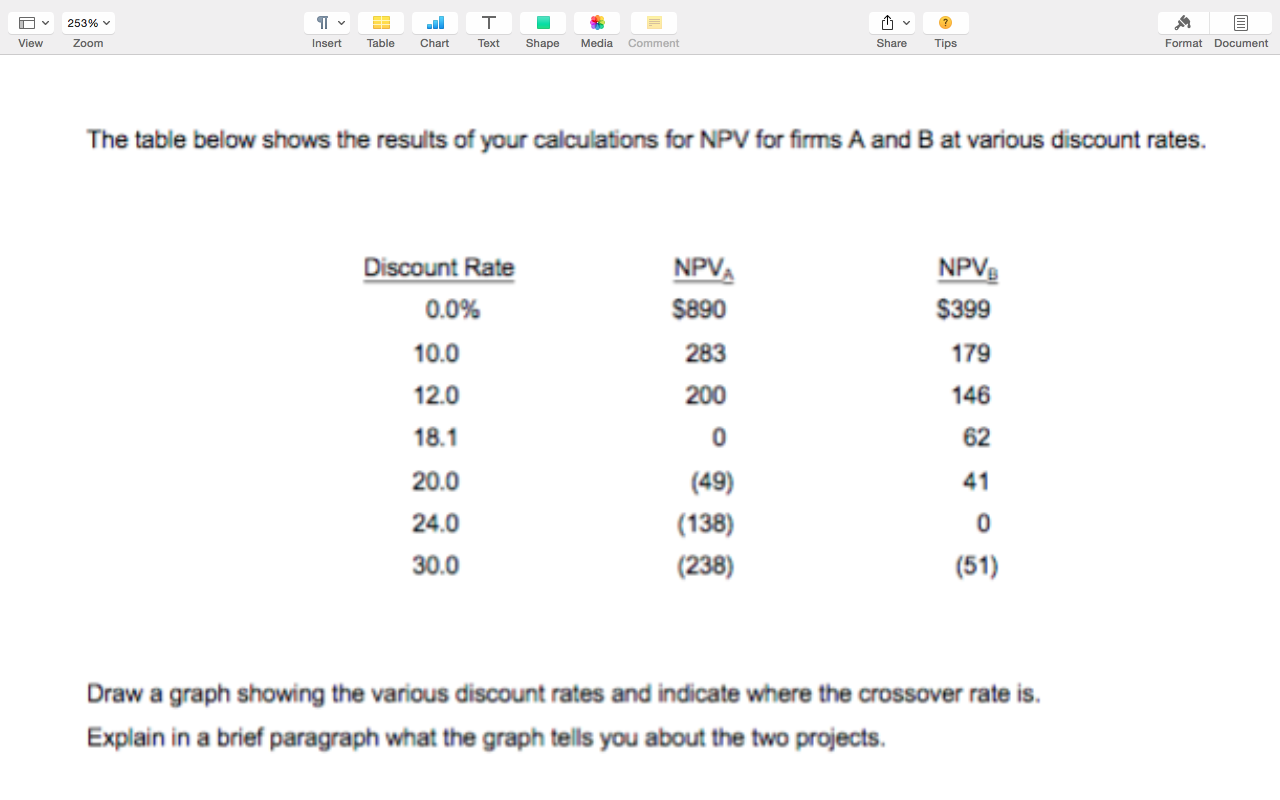
253% T Text tv Share View Zoom Insert Table Chart Shape Media Comment Tips Format Document The table below shows the results of your calculations
Step by Step Solution
There are 3 Steps involved in it
Step: 1

Get Instant Access to Expert-Tailored Solutions
See step-by-step solutions with expert insights and AI powered tools for academic success
Step: 2

Step: 3
Ace Your Homework with AI
Get the answers you need in no time with our AI-driven, step-by-step assistance
Get Started
Entrepreneurial Finance
Authors: J. Chris Leach, Ronald W. Melicher
6th edition
1305968352, 978-1337635653, 978-1305968356