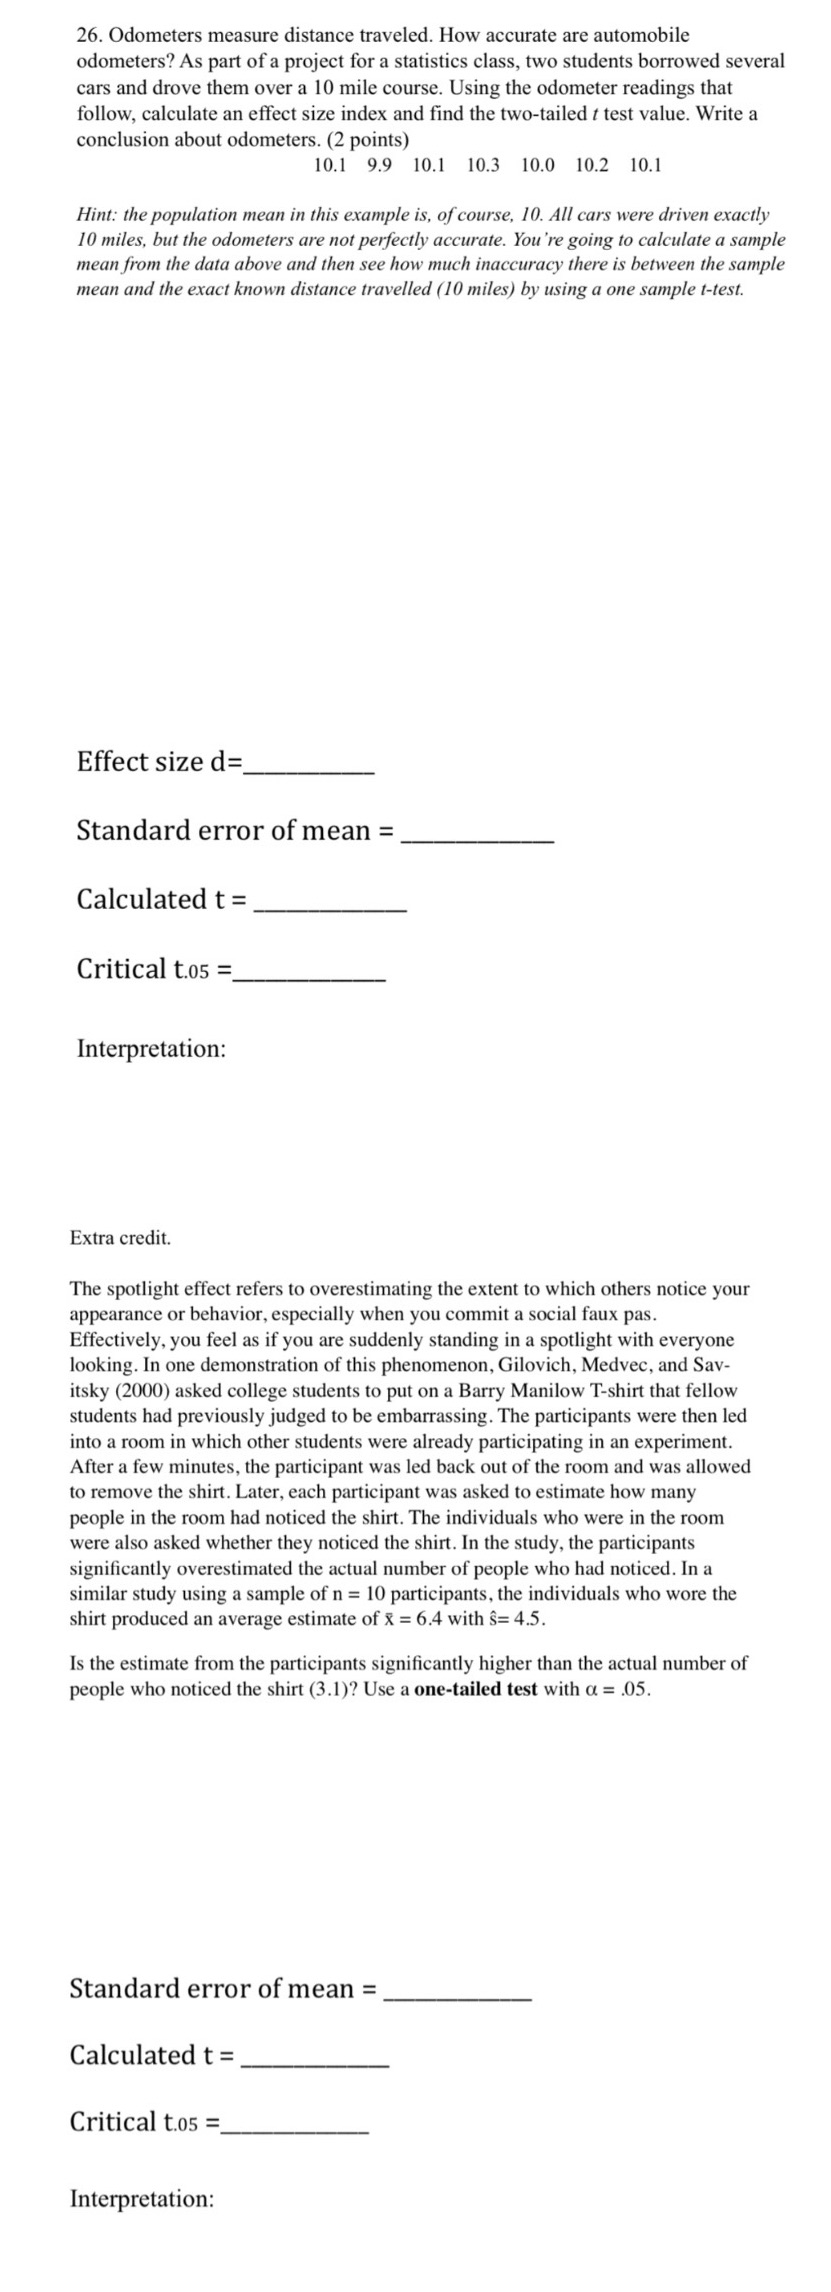
26. Odometers measure distance traveled. How accurate are automobile odometers? As part of a project for a statistics class, two students borrowed several cars and drove them over a 10 mile course. Using the odometer readings that follow, calculate an effect size index and find the two-tailed t test value. Write a conclusion about odometers. (2 points) 10.1 9.9 10.1 10.3 10.0 10.2 10.1 Hint: the population mean in this example is, of course, 10. All cars were driven exactly 10 miles, but the odometers are not perfectly accurate. You're going to calculate a sample mean from the data above and then see how much inaccuracy there is between the sample mean and the exact known distance travelled (10 miles) by using a one sample t-test. Effect size d= Standard error of mean = Calculated t = Critical t.05 = Interpretation: Extra credit. The spotlight effect refers to overestimating the extent to which others notice your appearance or behavior, especially when you commit a social faux pas. Effectively, you feel as if you are suddenly standing in a spotlight with everyone looking. In one demonstration of this phenomenon, Gilovich, Medvec, and Sav- itsky (2000) asked college students to put on a Barry Manilow T-shirt that fellow students had previously judged to be embarrassing. The participants were then led into a room in which other students were already participating in an experiment. After a few minutes, the participant was led back out of the room and was allowed to remove the shirt. Later, each participant was asked to estimate how many people in the room had noticed the shirt. The individuals who were in the room were also asked whether they noticed the shirt. In the study, the participants significantly overestimated the actual number of people who had noticed. In a similar study using a sample of n = 10 participants, the individuals who wore the shirt produced an average estimate of x = 6.4 with $= 4.5. Is the estimate from the participants significantly higher than the actual number of people who noticed the shirt (3.1)? Use a one-tailed test with a = .05. Standard error of mean = Calculated t = Critical t.05 = Interpretation


