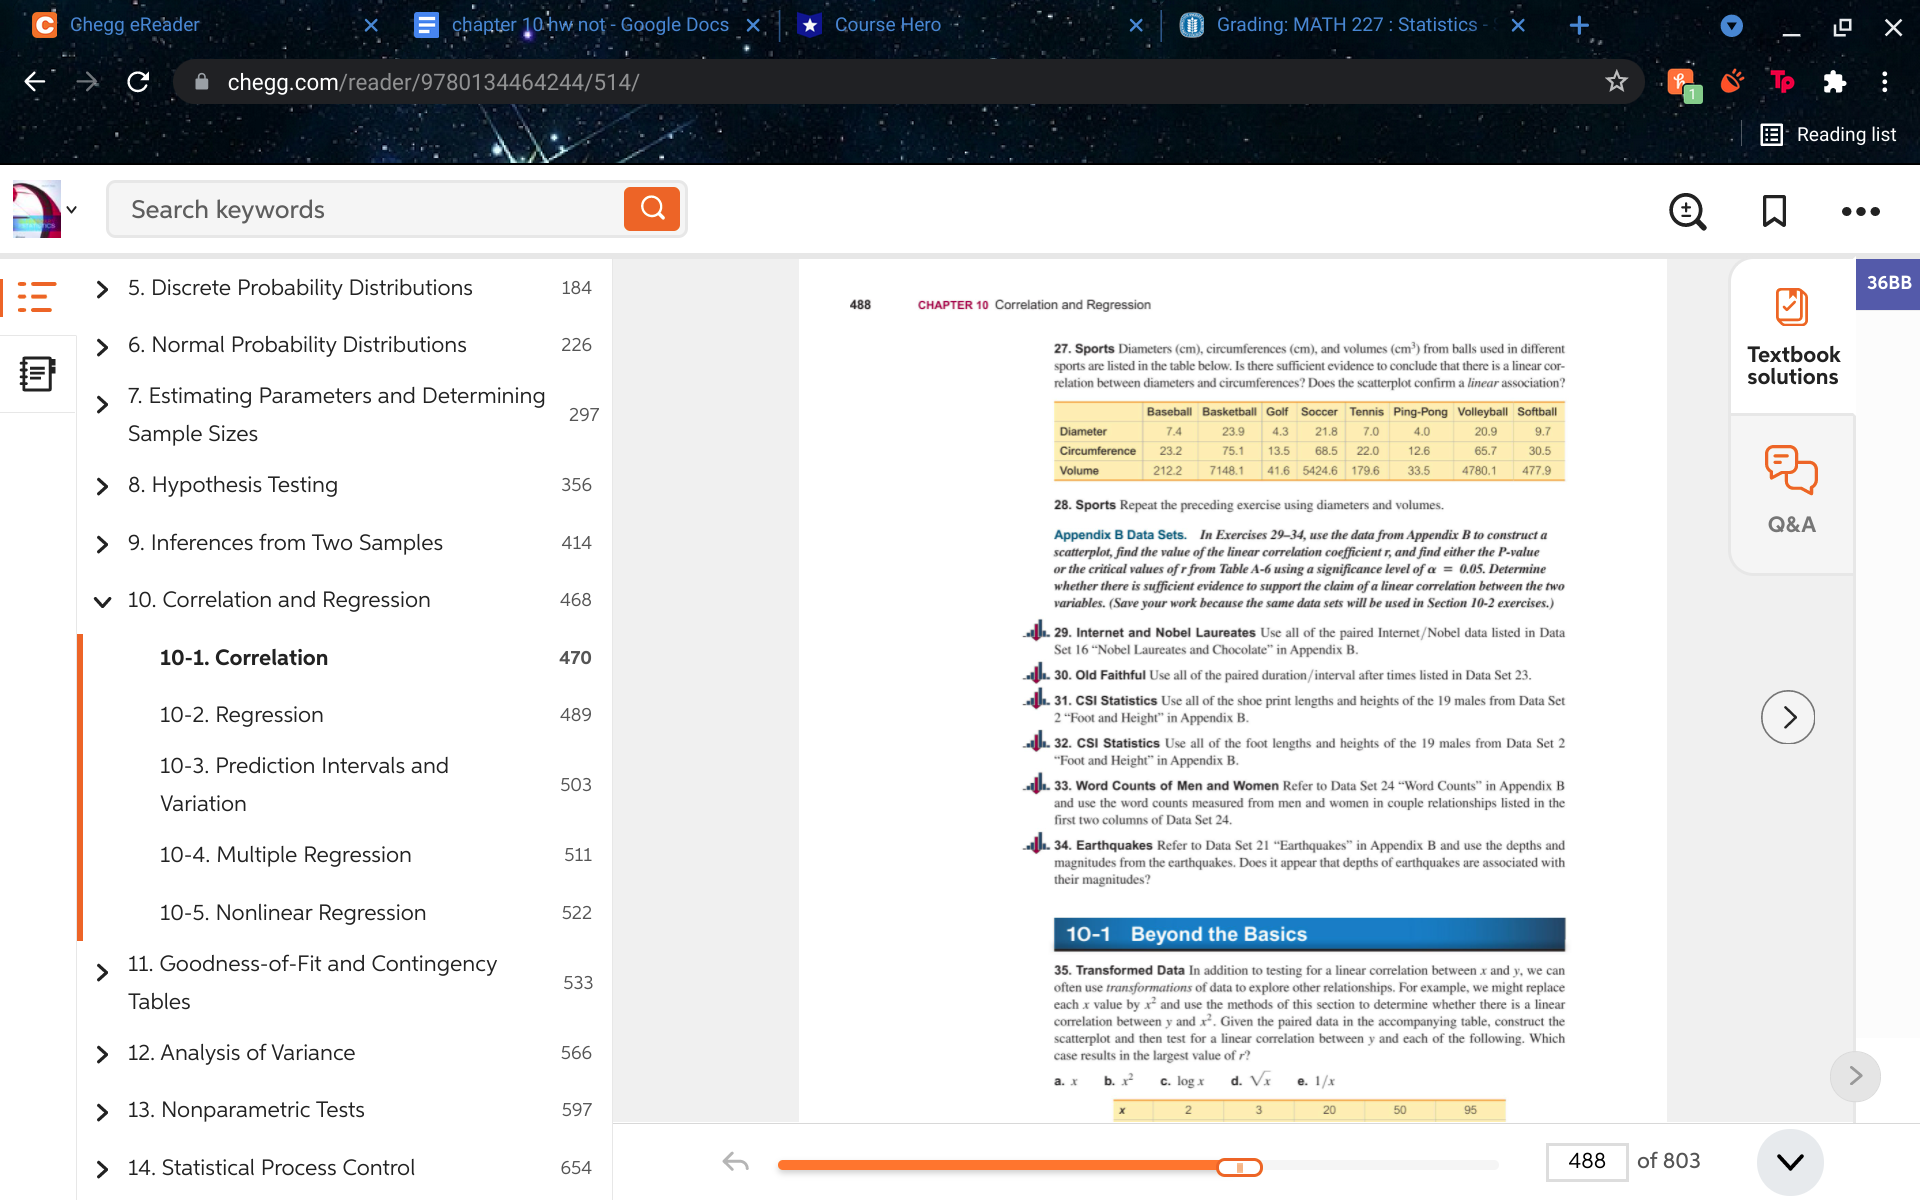
27. Sports Diameters (cm), circumferences (cm), and volumes (cm3) from balls used in different sports are listed in the table below. Is there sufficient evidence to conclude that there is a linear cor-relation between diameters and circumferences? Does the scatterplot confirm a linear association?
C Chegg eReader chapter 10 hw not - Google Docs_ X. *Course Hero Grading: MATH 227 : Statistics X A X C chegg.com/reader/9780134464244/514/ To . .. Reading list 2 Search keywords Q W .. . > 5. Discrete Probability Distributions 184 36BB 488 CHAPTER 10 Correlation and Regression 6. Normal Probability Distributions 226 27. Sports Diameters (em), circumferences (cm), and volumes (cm ) from balls used in different sports are listed in the table below. Is there sufficient evidence to conclude that there is a linear cor- Textbook relation between diameters and circumferences? Does the scatterplot confirm a linear association? solutions 7. Estimating Parameters and Determining 297 Baseball Basketball Golf Soccer Tennis Ping-Pong Volleyball Softball Sample Sizes Diameter 7.4 23.9 4.3 21.8 7 7.0 4.0 20.9 9.7 Circumference 23.2 75.1 13.5 68.5 22.0 12.6 65.7 30.5 Volume 212.2 7148.1 41.6 5424.6 179.6 33.5 4780.1 477.9 > 8. Hypothesis Testing 356 28. Sports Repeat the preceding exercise using dian Q& A 9. Inferences from Two Samples 414 Appendix B Data Sets. In Exercises 29-34, use the data from Appendix B to construct a scatterplot, find the value of the linear correlation coefficient r, and find either the P-value or the critical values of r from Table A-6 using a significance level of a = 0.05. Determine 10. Correlation and Regression 168 whether there is sufficient evidence to support the claim of a linear correlation between the two variables. (Save your work because the same data sets will be used in Section 10-2 exercises.) . 29. Internet and Nobel Laureates Use all of the paired Internet/ Nobel data listed in Data 10-1. Correlation 470 Set 16 "Nobel Laureates and Chocolate" in Appendix B. J. 30. Old Faithful Use all of the paired duration/ interval after times listed in Data Set 23. J. 31. CSI Statistics Use all of the shoe print lengths and heights of the 19 males from Data Set 10-2. Regression 489 2 "Foot and Height" in Appendix B. > . 32. CSI Statistics Use all of the foot lengths and heights of the 19 males from Data Set 2 10-3. Prediction Intervals and "Foot and Height" in Appendix B. 503 J.. 33. Word Counts of Men and Women Refer to Data Set 24 "Word Counts" in Appendix B Variation nd use the word counts measured from men and women in couple relationships listed in the first two columns of Data Set 24. 10-4. Multiple Regression 511 J. 34. Earthquakes Refer to Data Set 21 "Earthquakes" in Appendix B and use the depths and magnitudes from the earthquakes. Does it appear that depths of earthquakes are associated with their magnitudes? 10-5. Nonlinear Regression 522 10-1 Beyond the Basics > 11. Goodness-of-Fit and Contingency 533 $5. Transformed Data In addition to testing for a linear correlation between x and y, we can often use transformations of data to explore other relationships. For example, we might replace Tables each x value by x" and use the methods of this section to determine whether there is a linear correlation between y and x". Given the paired data in the accompanying table, construct the scatterplot and then test for a linear correlation between y and each of the following. Which > 12. Analysis of Variance 566 case results in the largest value of r? a. x b. x2 c. log x d. Vx e. 1/x > 13. Nonparametric Tests 597 20 50 95 14. Statistical Process Control 654 488 of 803 V