

Answered step by step
Verified Expert Solution
Question
1 Approved Answer
27-30 31-34 35-38 39-42 The gas mileages (in miles per gallon) for 30 cars are shown in the frequency distribution. Approximate the mean of
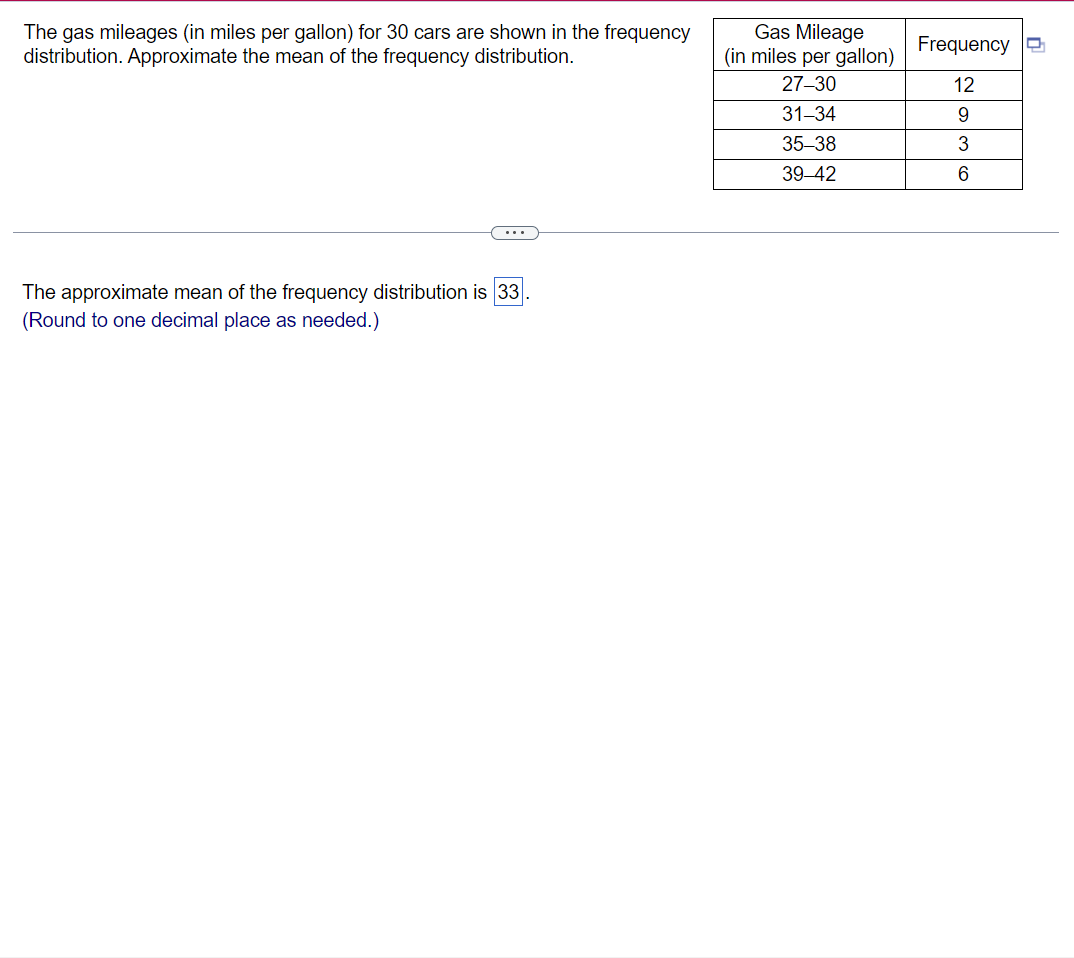
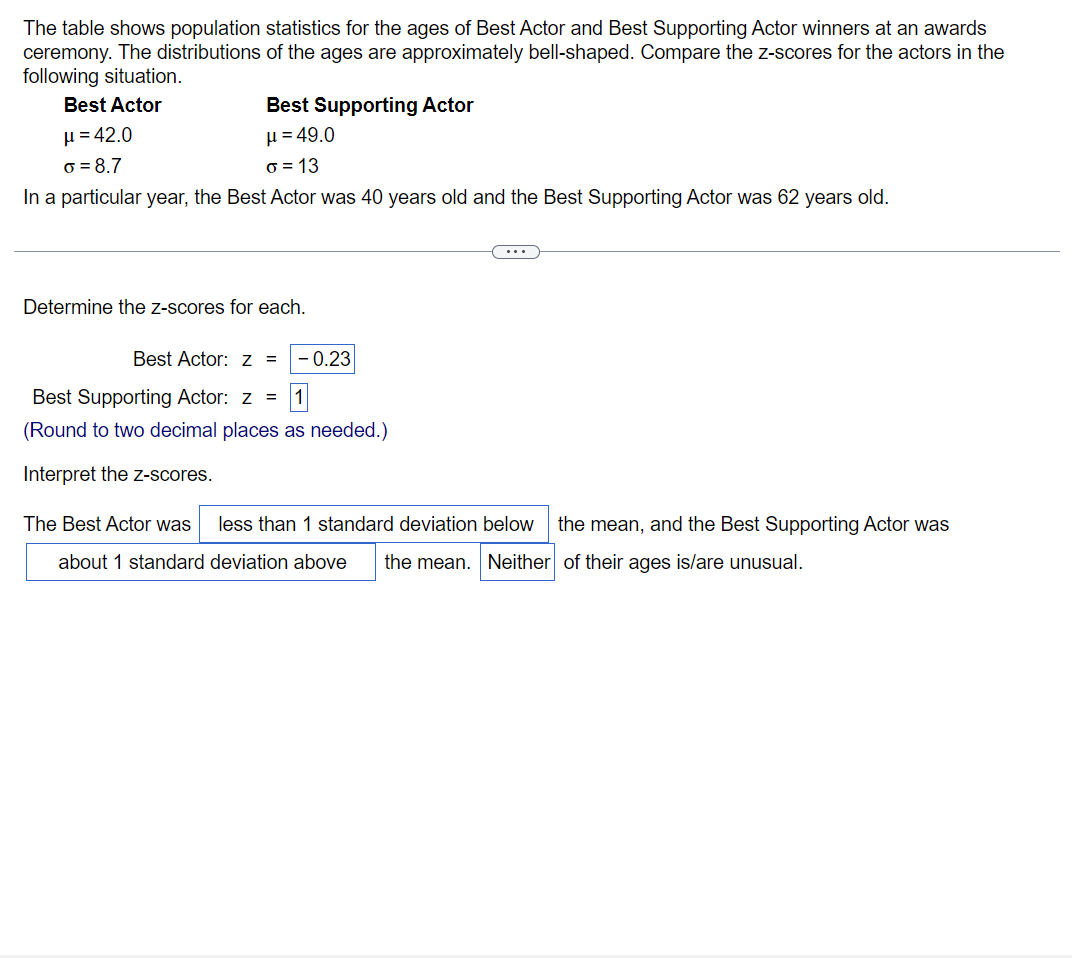
27-30 31-34 35-38 39-42 The gas mileages (in miles per gallon) for 30 cars are shown in the frequency distribution. Approximate the mean of the frequency distribution. Gas Mileage (in miles per gallon) The approximate mean of the frequency distribution is 33. (Round to one decimal place as needed.) Frequency 12 9 36 The table shows population statistics for the ages of Best Actor and Best Supporting Actor winners at an awards ceremony. The distributions of the ages are approximately bell-shaped. Compare the z-scores for the actors in the following situation. Best Actor =42.0 = 8.7 Best Supporting Actor = 49.0 = 13 In a particular year, the Best Actor was 40 years old and the Best Supporting Actor was 62 years old. Determine the z-scores for each. Best Actor: z = -0.23 Best Supporting Actor: z = 1 (Round to two decimal places as needed.) Interpret the z-scores. The Best Actor was less than 1 standard deviation below the mean, and the Best Supporting Actor was about 1 standard deviation above the mean. Neither of their ages is/are unusual.
Step by Step Solution
There are 3 Steps involved in it
Step: 1

Get Instant Access to Expert-Tailored Solutions
See step-by-step solutions with expert insights and AI powered tools for academic success
Step: 2

Step: 3
Ace Your Homework with AI
Get the answers you need in no time with our AI-driven, step-by-step assistance
Get Started
Differential Equations and Linear Algebra
Authors: Jerry Farlow, James E. Hall, Jean Marie McDill, Beverly H. West
2nd edition
131860615, 978-0131860612