

Answered step by step
Verified Expert Solution
Question
1 Approved Answer
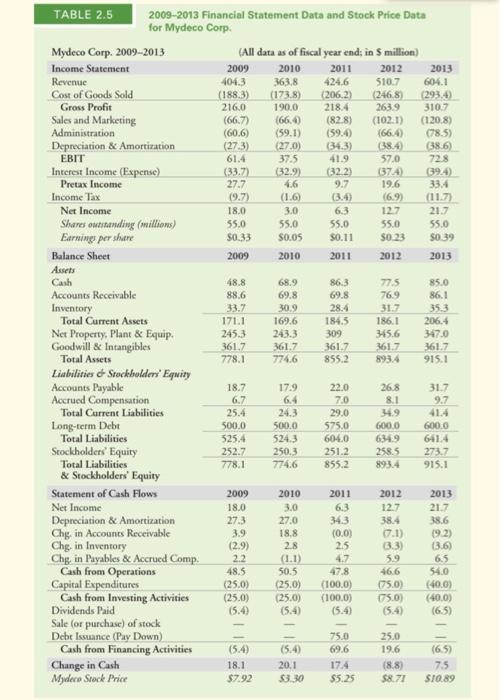
28. See Table 2.5 showing financial statement data and stock price data for Mydeco Corp. a. What were Mydeco's gross margins each year? b. Comparing
Step by Step Solution
There are 3 Steps involved in it
Step: 1

Get Instant Access to Expert-Tailored Solutions
See step-by-step solutions with expert insights and AI powered tools for academic success
Step: 2

Step: 3
Ace Your Homework with AI
Get the answers you need in no time with our AI-driven, step-by-step assistance
Get Started
Questions And Answers On Finance Of International Trade
Authors: L. Waxman
1st Edition
0860105865, 978-0860105862