Answered step by step
Verified Expert Solution
Question
1 Approved Answer
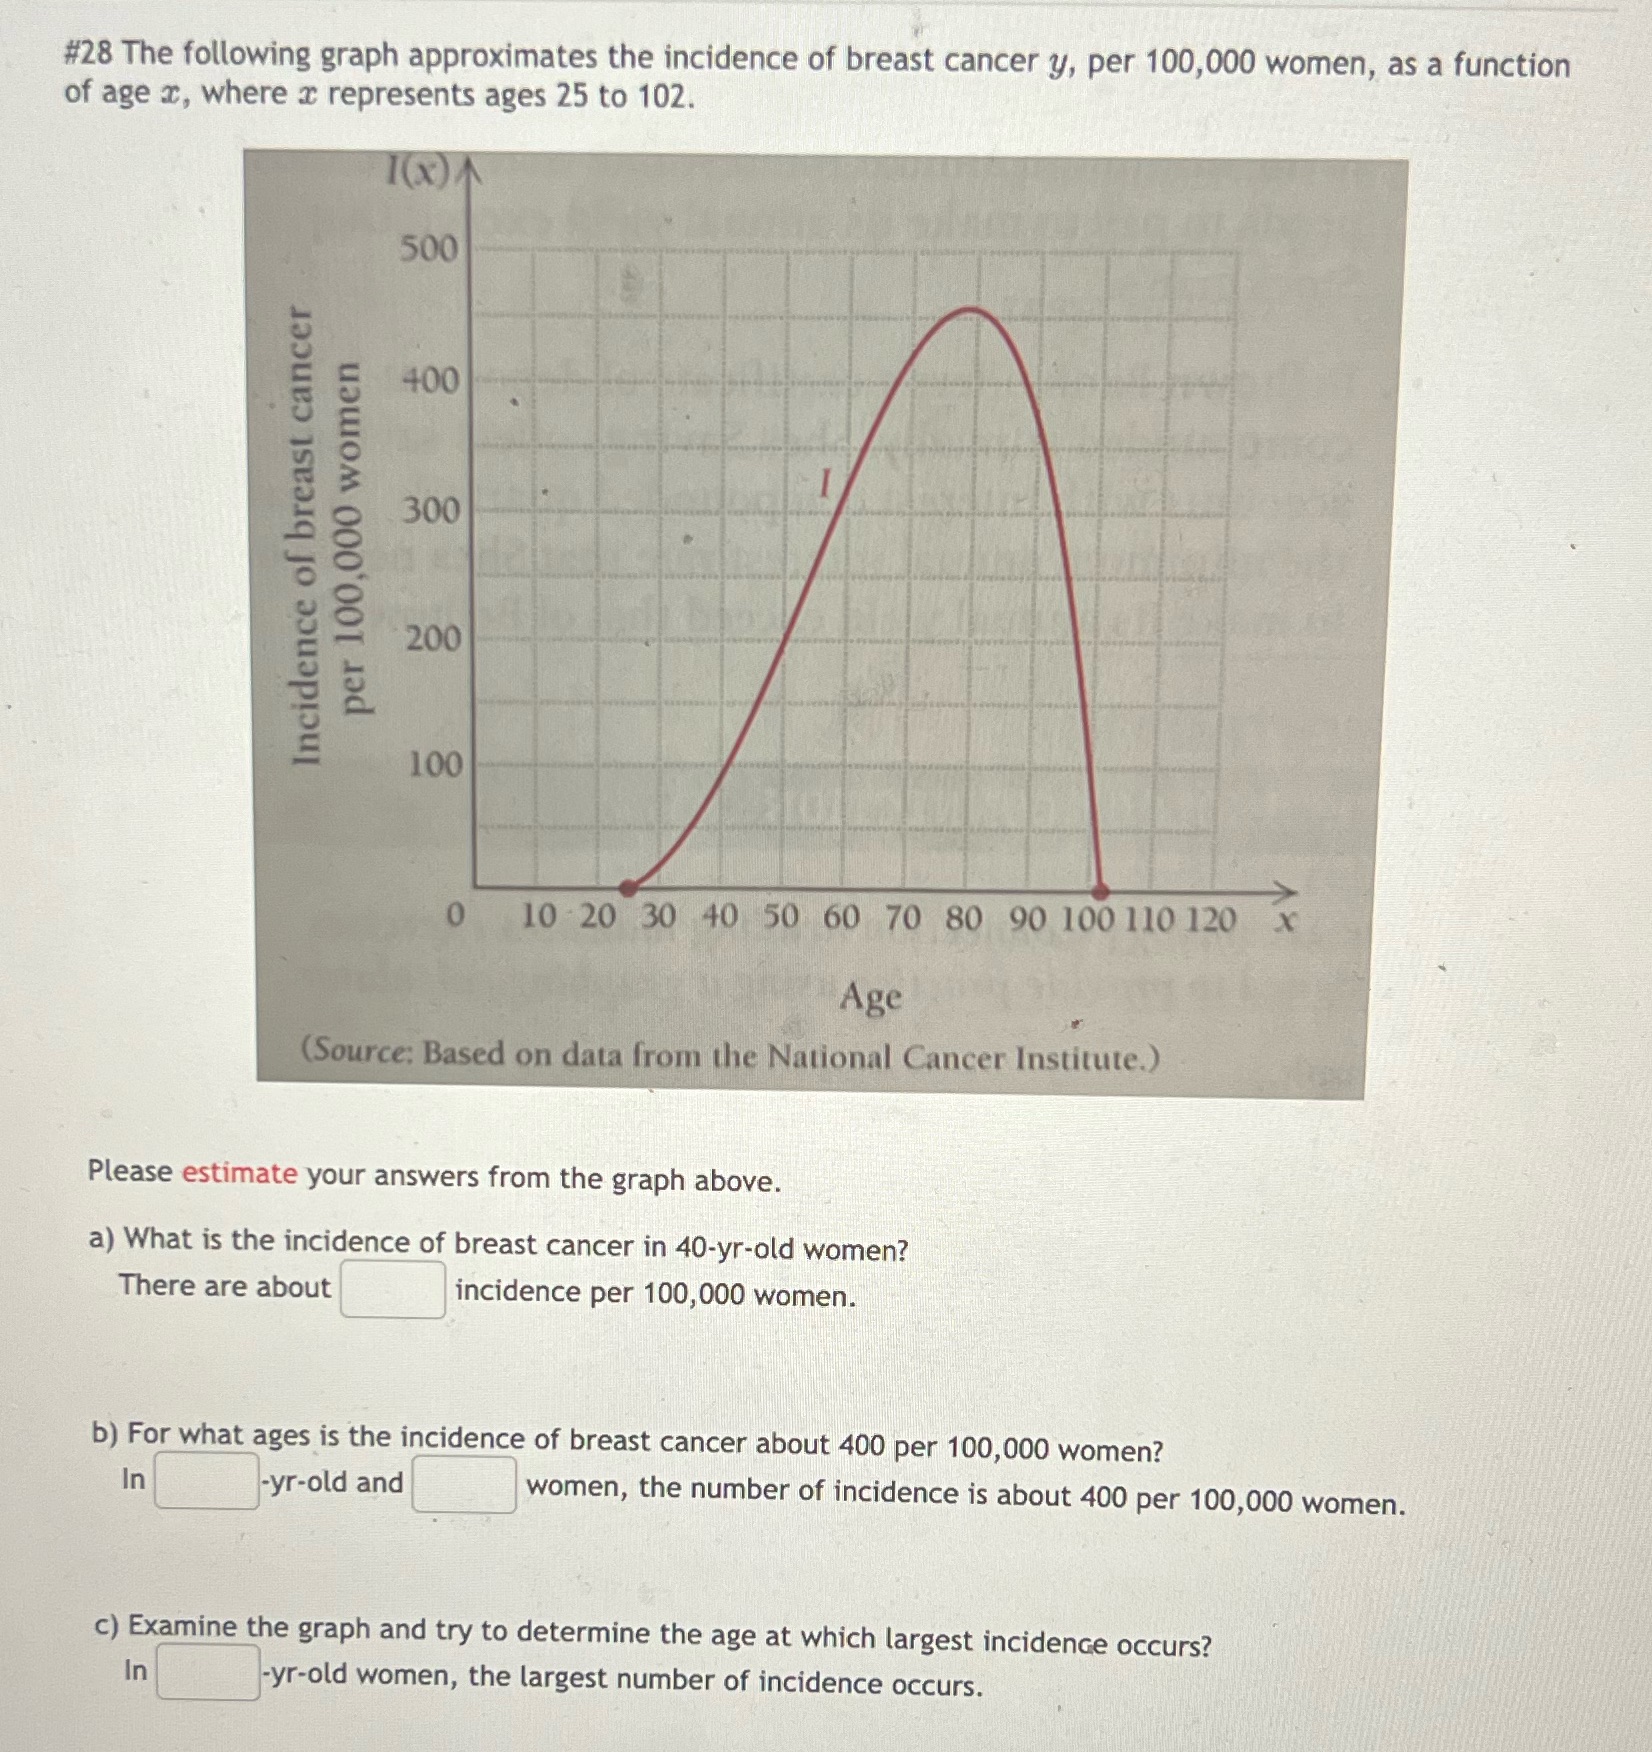
# 28 The following graph approximates the incidence of breast cancer y, per 100,000 women, as a function of age , where a represents

# 28 The following graph approximates the incidence of breast cancer y, per 100,000 women, as a function of age , where a represents ages 25 to 102. 1(x) A Incidence of breast cancer per 100,000 women 500 400 300 200 100 0 10 20 30 40 50 60 70 80 90 100 110 120 Age (Source: Based on data from the National Cancer Institute.) Please estimate your answers from the graph above. a) What is the incidence of breast cancer in 40-yr-old women? There are about incidence per 100,000 women. b) For what ages is the incidence of breast cancer about 400 per 100,000 women? -yr-old and In X women, the number of incidence is about 400 per 100,000 women. c) Examine the graph and try to determine the age at which largest incidence occurs? -yr-old women, the largest number of incidence occurs. In
Step by Step Solution
★★★★★
3.38 Rating (148 Votes )
There are 3 Steps involved in it
Step: 1
Solutions Step 1 Explanation The question pertains to cancer epidemiology specifically addressing br...
Get Instant Access to Expert-Tailored Solutions
See step-by-step solutions with expert insights and AI powered tools for academic success
Step: 2

Step: 3

Ace Your Homework with AI
Get the answers you need in no time with our AI-driven, step-by-step assistance
Get Started


