Answered step by step
Verified Expert Solution
Link Copied!

Question

1 Approved Answer

28) What chart helps to identify the relatively few factors that impact the performance of a manufacturing or service process? A) SPC B) Pareto analysis
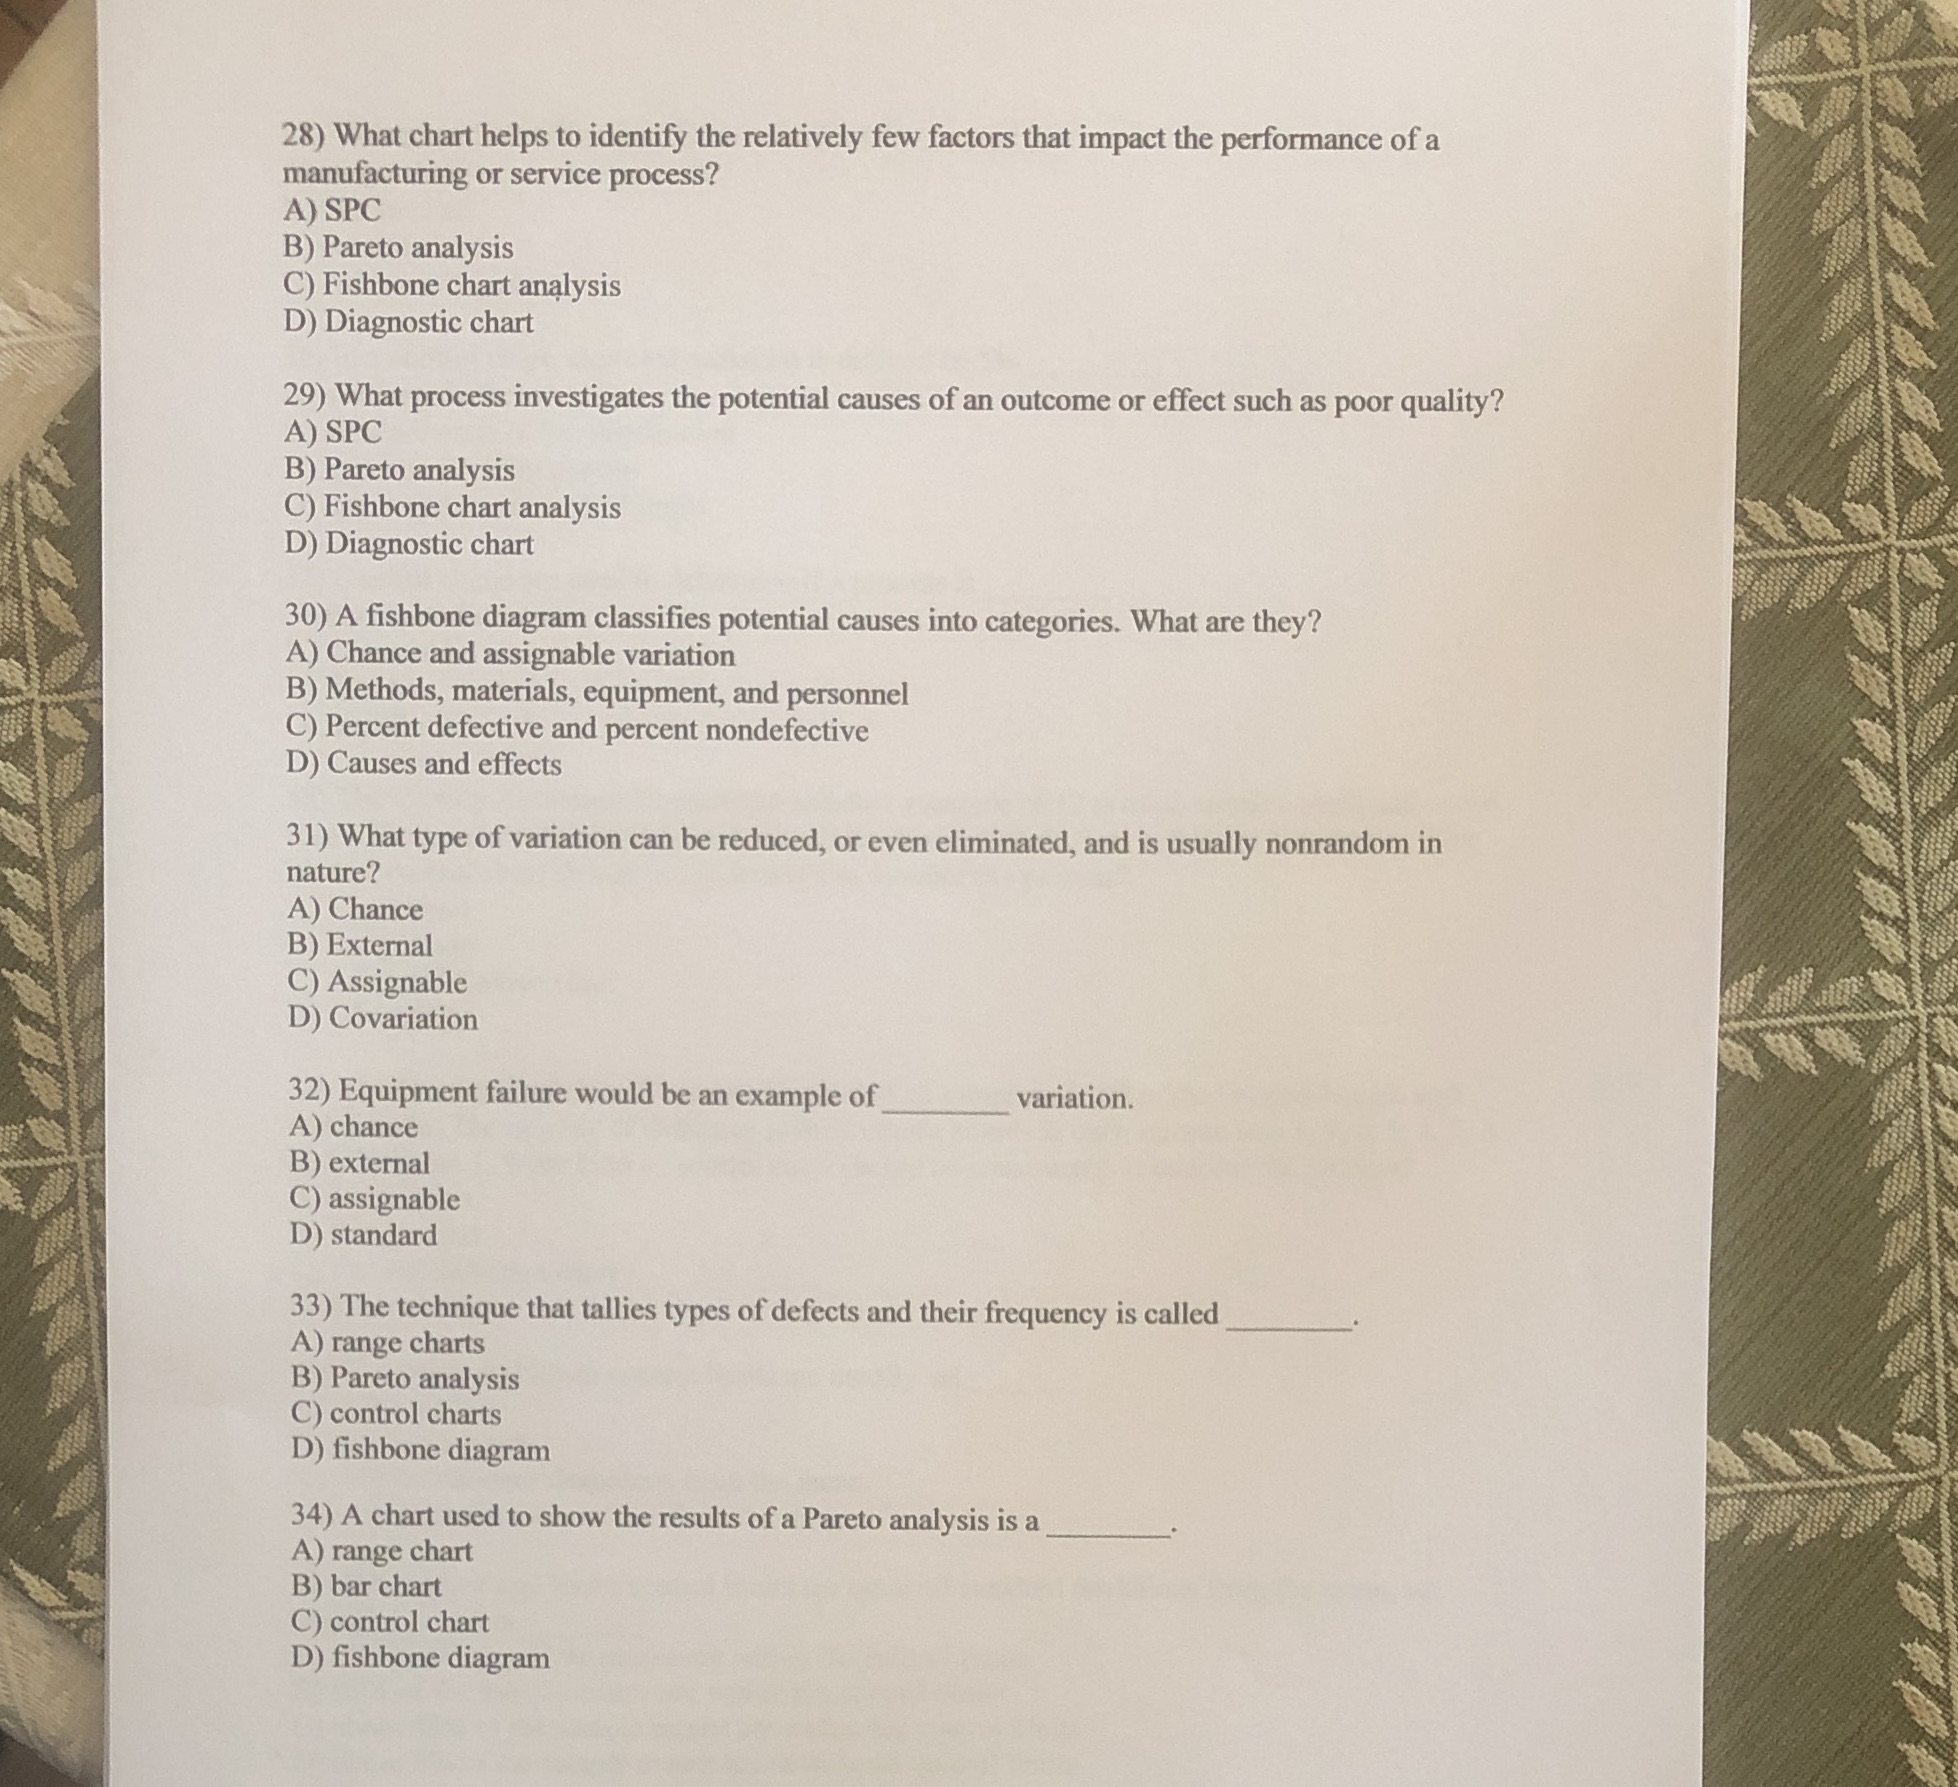
image text in transcribed
28) What chart helps to identify the relatively few factors that impact the performance of a manufacturing or service process? A) SPC B) Pareto analysis C) Fishbone chart analysis D) Diagnostic chart 29) What process investigates the potential causes of an outcome or effect such as poor quality? A) SPC B) Pareto analysis C) Fishbone chart analysis D) Diagnostic chart 30) A fishbone diagram classifies potential causes into categories. What are they? A) Chance and assignable variation B) Methods, materials, equipment, and personnel C) Percent defective and percent nondefective D) Causes and effects 31) What type of variation can be reduced, or even eliminated, and is usually nonrandom in nature? A) Chance B) External C) Assignable D) Covariation 32) Equipment failure would be an example of variation. A) chance B) external C) assignable D) standard 33) The technique that tallies types of defects and their frequency is called A) range charts B) Pareto analysis C) control charts D) fishbone diagram 34) A chart used to show the results of a Pareto analysis is a A) range chart B) bar chart C) control chart D) fishbone diagram

Step by Step Solution

There are 3 Steps involved in it

Step: 1

blur-text-image

Get Instant Access to Expert-Tailored Solutions

See step-by-step solutions with expert insights and AI powered tools for academic success

Step: 2

blur-text-image

Step: 3

blur-text-image

Ace Your Homework with AI

Get the answers you need in no time with our AI-driven, step-by-step assistance

Get Started

Recommended Textbook for

Elementary Algebra

Authors: Charles P McKeague

2nd Edition

1483263819, 9781483263816

More Books

Students also viewed these Mathematics questions