Answered step by step
Verified Expert Solution
Question
1 Approved Answer
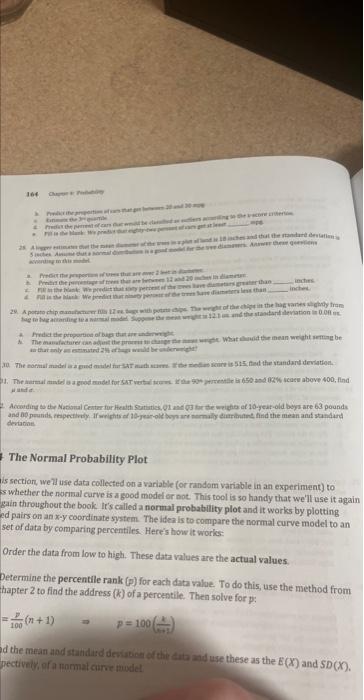
#29 is atet it. devacinit The Normal Probability Plot is section, we ll use data collected on a variable (or random variable in an experiment)
#29 
is atet it. devacinit The Normal Probability Plot is section, we ll use data collected on a variable (or random variable in an experiment) to s whether the normal curve is a good model or not. This tool is so handy that we'll use it again gain throughout the book it's called a normal probability plot and it works by plotting ed pairs on an x-y coordinate system. The idea is to compare the normal curve model to an set of data by comparing percentiles. Here's how it works: Order the data from low to high. These data values are the actual values. Determine the percentile rank (p) for each data ralue. To do this, use the method from thapter 2 to fiad the address ( (k) of a percentile. Then solve for p : =100p(n+1)p=100(1+1k) d the mean and staindiad doviabica of thit data and use these as the E(X) and SD(X). pectively, of a normat cirve mudel is atet it. devacinit The Normal Probability Plot is section, we ll use data collected on a variable (or random variable in an experiment) to s whether the normal curve is a good model or not. This tool is so handy that we'll use it again gain throughout the book it's called a normal probability plot and it works by plotting ed pairs on an x-y coordinate system. The idea is to compare the normal curve model to an set of data by comparing percentiles. Here's how it works: Order the data from low to high. These data values are the actual values. Determine the percentile rank (p) for each data ralue. To do this, use the method from thapter 2 to fiad the address ( (k) of a percentile. Then solve for p : =100p(n+1)p=100(1+1k) d the mean and staindiad doviabica of thit data and use these as the E(X) and SD(X). pectively, of a normat cirve mudel 
Step by Step Solution
There are 3 Steps involved in it
Step: 1

Get Instant Access to Expert-Tailored Solutions
See step-by-step solutions with expert insights and AI powered tools for academic success
Step: 2

Step: 3

Ace Your Homework with AI
Get the answers you need in no time with our AI-driven, step-by-step assistance
Get Started


