

Question
2.)Using at least 10 data elements of your choice create two types of charts in an Excel spreadsheet. 3.)Calculate the LOS for the following data
2.)Using at least 10 data elements of your choice create two types of charts in an Excel spreadsheet.
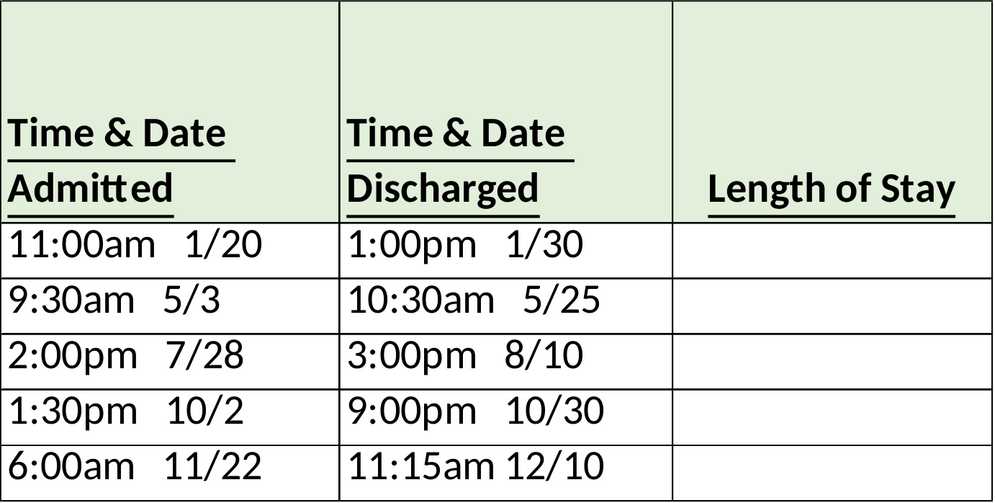
3.)Calculate the LOS for the following data and enter it for each set of dates in the column indicated. Assume that the patient count occurs at noon each day. round up if necessary.


Step by Step Solution
There are 3 Steps involved in it
Step: 1

Get Instant Access to Expert-Tailored Solutions
See step-by-step solutions with expert insights and AI powered tools for academic success
Step: 2

Step: 3
Ace Your Homework with AI
Get the answers you need in no time with our AI-driven, step-by-step assistance
Get Started
Practical Linear Algebra A Geometry Toolbox
Authors: Gerald Farin, Dianne Hansford
4th Edition
1003051219, 9781003051213