Question
2.Which of the following might you use to best displaycategoricaldata? Histogram Pictogram Line graph Stem plot Scatter plot 5.Ohio University sorted 150 new students into
2.Which of the following might you use tobestdisplaycategoricaldata?
Histogram
Pictogram
Line graph
Stem plot
Scatter plot
5.Ohio University sorted 150 new students into one of the four residence hall greens as follows: East Green 44, South Green 40, West Green 35, and North Green 31. In a Chi-Square test, what would thesum(total) of theEXPECTED values/frequenciesbe for East Green and South Green?(Hint:First calculate the expected values/frequencies for each Green.Then add together the expected values/frequencies for the East and South Greens.)
37.5
42
75
84
150
6.A Chi-square goodness-of-fit test was conducted on voter preferences in a state primary (with candidates A, B, C, and D) that yielded a calculated/obtained statistic of 6.22. If you used a critical value of 7.82 to determine if the voters significantly preferred one candidate over another, what conclusion would you draw?
a.Voters showed no significant preference
b.Voters showed a significant preference
c.Voters showed a significant preference for candidate A over the others
d.Not enough information is given to be able to answer this question
e.Answers B and C are both correct
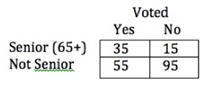
7.Calculate theexpected value/frequencyfor each cell of the table below, for this Chi-Square Test for Independence.What would thesum(total) of theexpected values/frequenciesbe for theSenior/Yes celland theSenior/No cell?(Hint:calculate the expected values/frequencies for each cell.Then add together the expected values/frequencies for the Senior/Yes cell and the Senior/No cell.)


Step by Step Solution
There are 3 Steps involved in it
Step: 1

Get Instant Access to Expert-Tailored Solutions
See step-by-step solutions with expert insights and AI powered tools for academic success
Step: 2

Step: 3

Ace Your Homework with AI
Get the answers you need in no time with our AI-driven, step-by-step assistance
Get Started


