Answered step by step
Verified Expert Solution
Question
1 Approved Answer
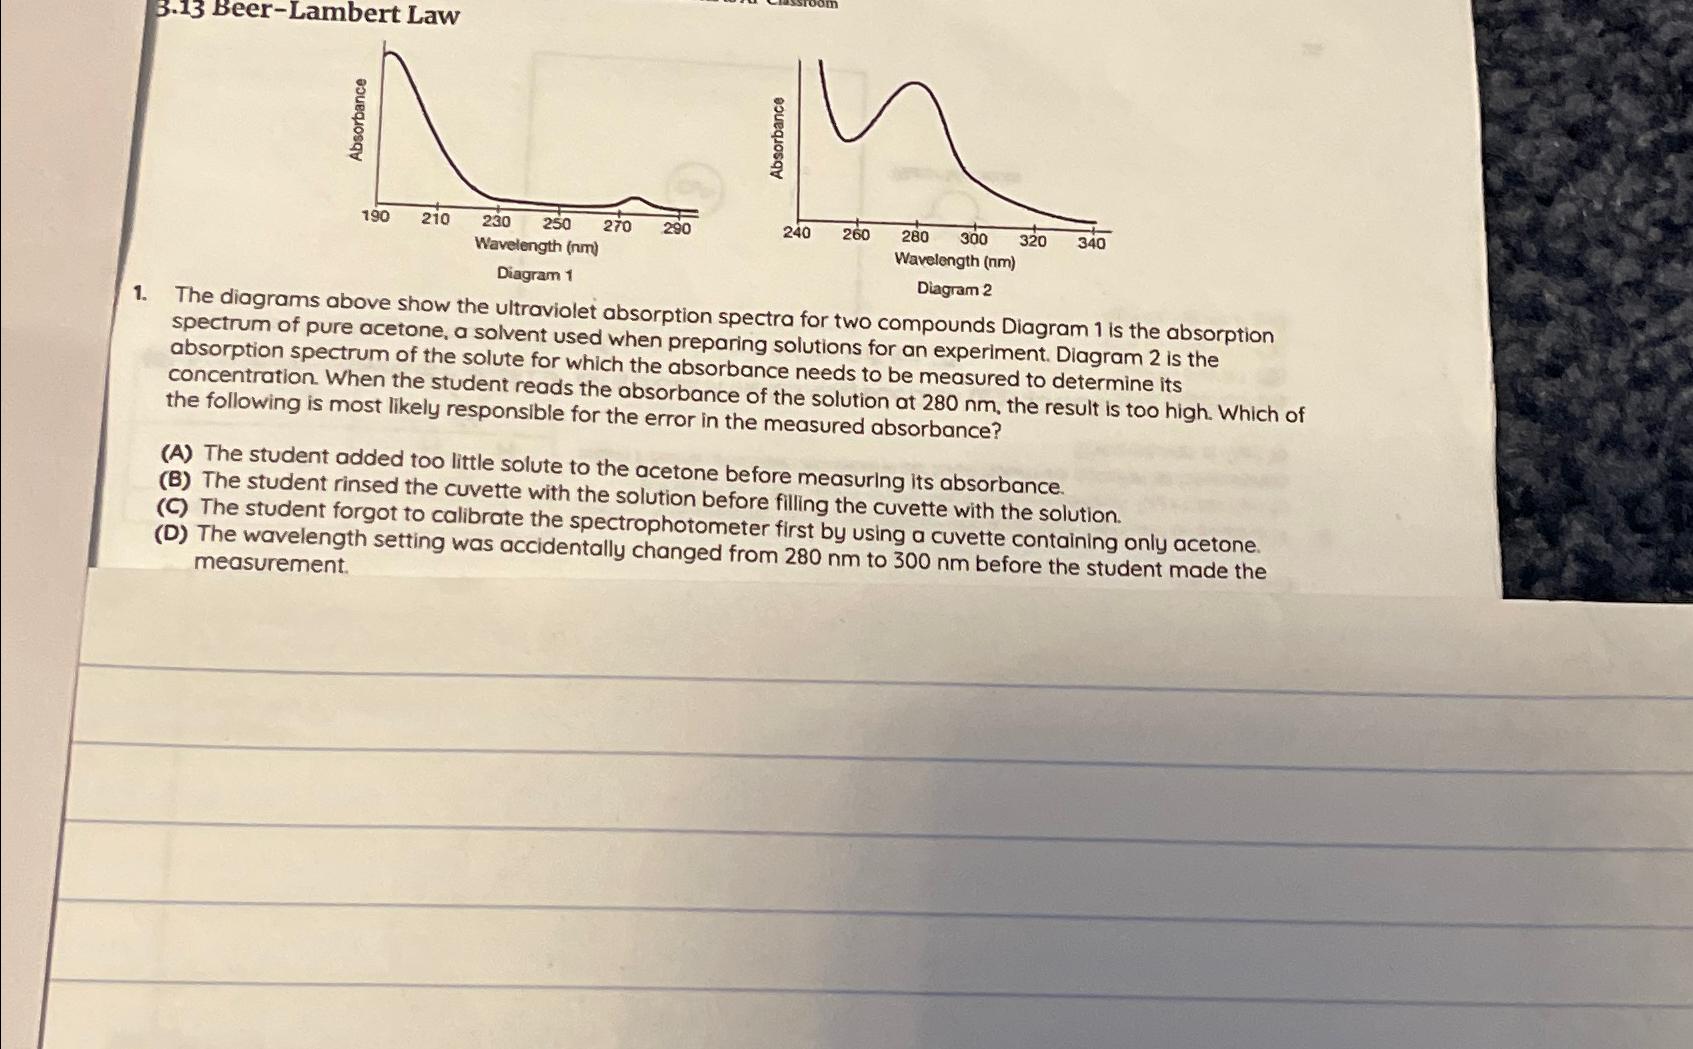
3 . 1 3 Beer - Lambert Law The diagrams above show the ultraviolet absorption spectra for two compounds Diagram 1 is the absorption spectrum
BeerLambert Law
The diagrams above show the ultraviolet absorption spectra for two compounds Diagram is the absorption spectrum of pure acetone, a solvent used when preparing solutions for an experiment. Diagram is the absorption spectrum of the solute for which the absorbance needs to be measured to determine its concentration. When the student reads the absorbance of the solution at the result is too high. Which of the following is most likely responsible for the error in the measured absorbance
A The student added too little solute to the acetone before measuring its absorbance
B The student rinsed the cuvette with the solution before filling the cuvette with the solution.
C The student forgot to calibrate the spectrophotometer first by using a cuvette containing only acetone.
D The wavelength setting was accidentally changed from to before the student made the measurement.

Step by Step Solution
There are 3 Steps involved in it
Step: 1

Get Instant Access to Expert-Tailored Solutions
See step-by-step solutions with expert insights and AI powered tools for academic success
Step: 2

Step: 3

Ace Your Homework with AI
Get the answers you need in no time with our AI-driven, step-by-step assistance
Get Started


