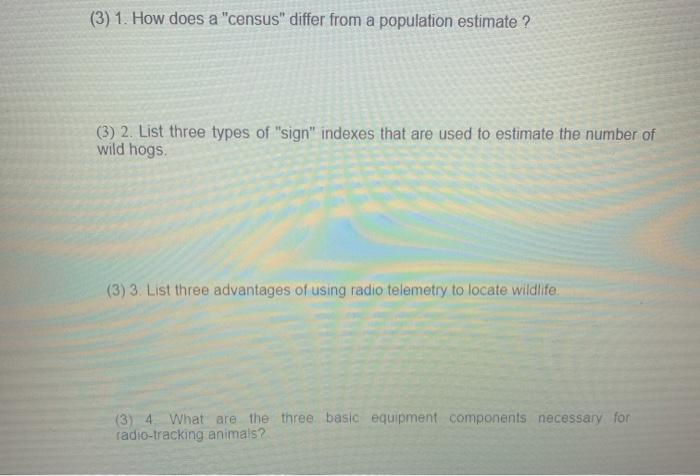
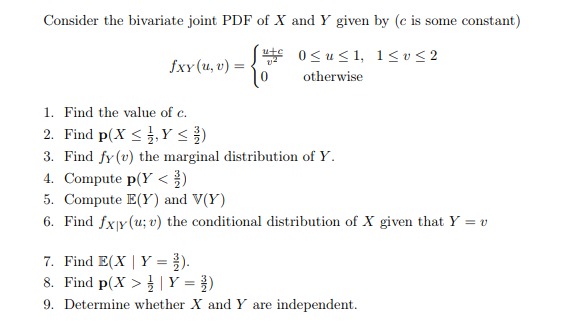
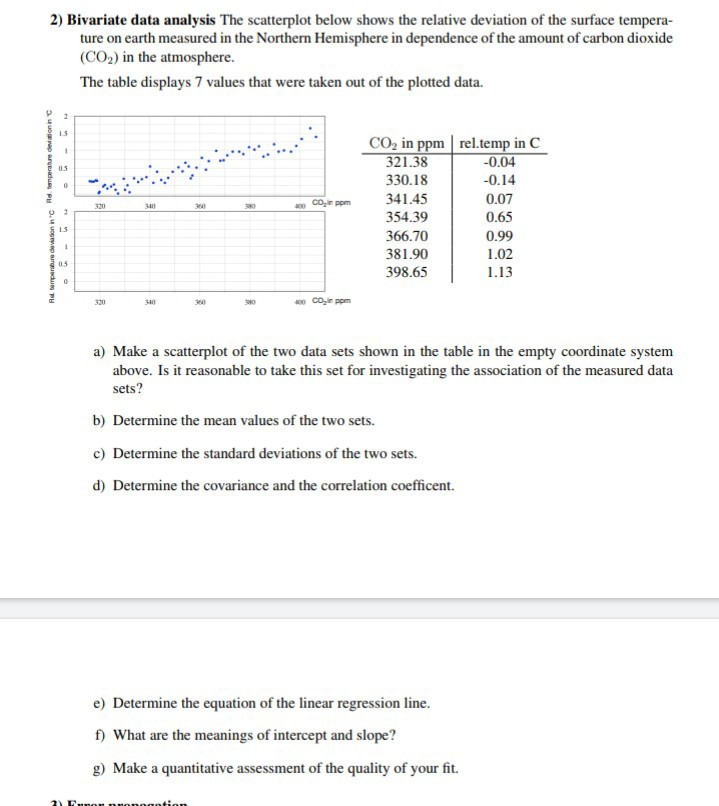
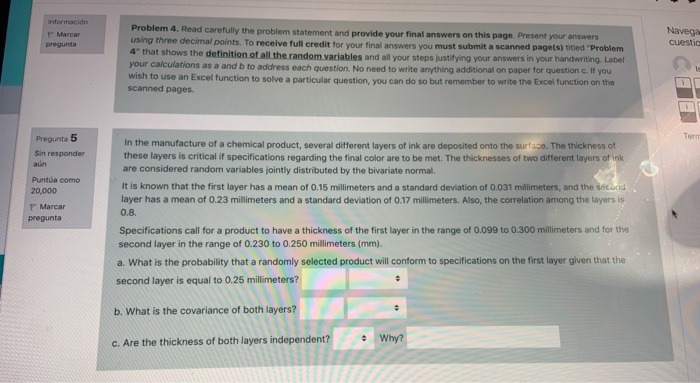
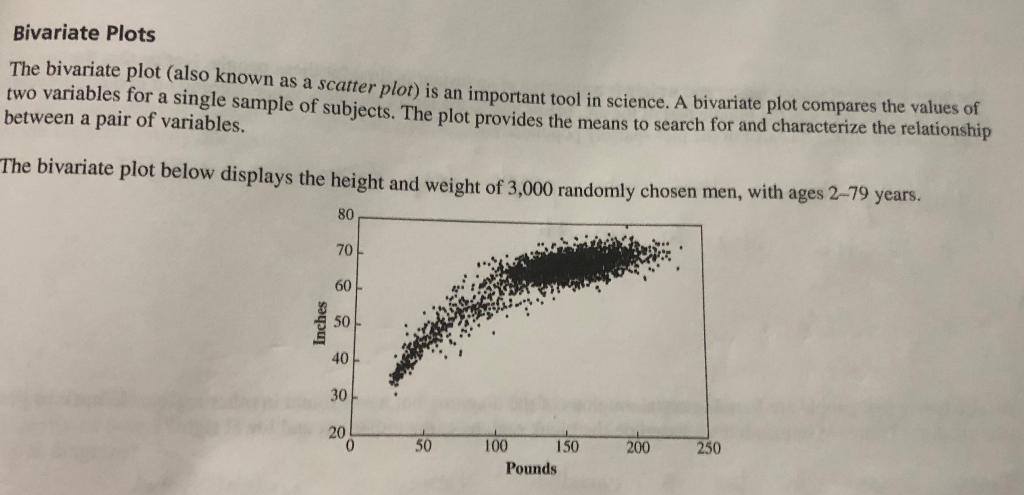
(3) 1. How does a "census" differ from a population estimate ? (3) 2. List three types of "sign" indexes that are used to estimate the number of wild hogs (3) 3. List three advantages of using radio telemetry to locate wildlife (3) 4 What are the three basic equipment components necessary for radio-tracking animals?Consider the bivariate joint PDF of X and Y given by (c is some constant) fxy (u, v) = otherwise 1. Find the value of c. 2. Find p(X Sys 3. Find fy(v) the marginal distribution of Y. 4. Compute p(Y |Y = ) 9. Determine whether X and Y are independent.2) Bivariate data analysis The scatterplot below shows the relative deviation of the surface tempera- ture on earth measured in the Northern Hemisphere in dependence of the amount of carbon dioxide (CO2) in the atmosphere. The table displays 7 values that were taken out of the plotted data. CO2 in ppm rel.temp in C 321.38 -0.04 330.18 -0.14 310 win COyin ppm 341.45 0.07 Fid temperature daviation inc Hel. temperature deviationin 354.39 0.65 366.70 0.99 381.90 1.02 398.65 1.13 310 360 10 COjim ppm a) Make a scatterplot of the two data sets shown in the table in the empty coordinate system above. Is it reasonable to take this set for investigating the association of the measured data sets? b) Determine the mean values of the two sets. c) Determine the standard deviations of the two sets. d) Determine the covariance and the correlation coefficent. e) Determine the equation of the linear regression line. f) What are the meanings of intercept and slope? g) Make a quantitative assessment of the quality of your fit.viformacidn Navega Marcar Problem 4. Read carefully the problem statement and provide your final answers on this page, Present your answers cuestic puregunda using three decimal points. To receive full credit for your final answers you must submit a scanned page(s) titled "Problem 4" that shows the definition of all the random variables and all your steps justifying your answers in your handwriting. Label your calculations as a and b to address each question. No need to write anything additional on paper for question c. If you wish to use an Excel function to solve a particular question, you can do so but remember to write the Excel function on the scanned pages. Progunis 5 In the manufacture of a chemical product, several different layers of ink are deposited onto the surface. The thickness of Sin responder these layers is critical if specifications regarding the final color are to be met. The thicknesses of two different layers of ink auin are considered random variables jointly distributed by the bivariate normal. Puntun come 20,000 It is known that the first layer has a mean of 0.15 millimeters and a standard deviation of 0.031 millimeters, and the second layer has a mean of 0.23 millimeters and a standard deviation of 0.17 millimeters. Also, the correlation among the layers is F Marcar 0.8. pregurita Specifications call for a product to have a thickness of the first layer in the range of 0.099 to 0.300 millimeters and for the second layer in the range of 0.230 to 0.250 millimeters (mm). a. What is the probability that a randomly selected product will conform to specifications on the first layer given that the second layer is equal to 0.25 millimeters? b. What is the covariance of both layers? c. Are the thickness of both layers independent? Why?Bivariate Plots The bivariate plot (also known as a scatter plot) is an important tool in science. A bivariate plot compares the values of two variables for a single sample of subjects. The plot provides the means to search for and characterize the relationship between a pair of variables. The bivariate plot below displays the height and weight of 3,000 randomly chosen men, with ages 2-79 years. 80 70 60 Inches 50 40 30 20 0 50 100 150 200 250 Pounds