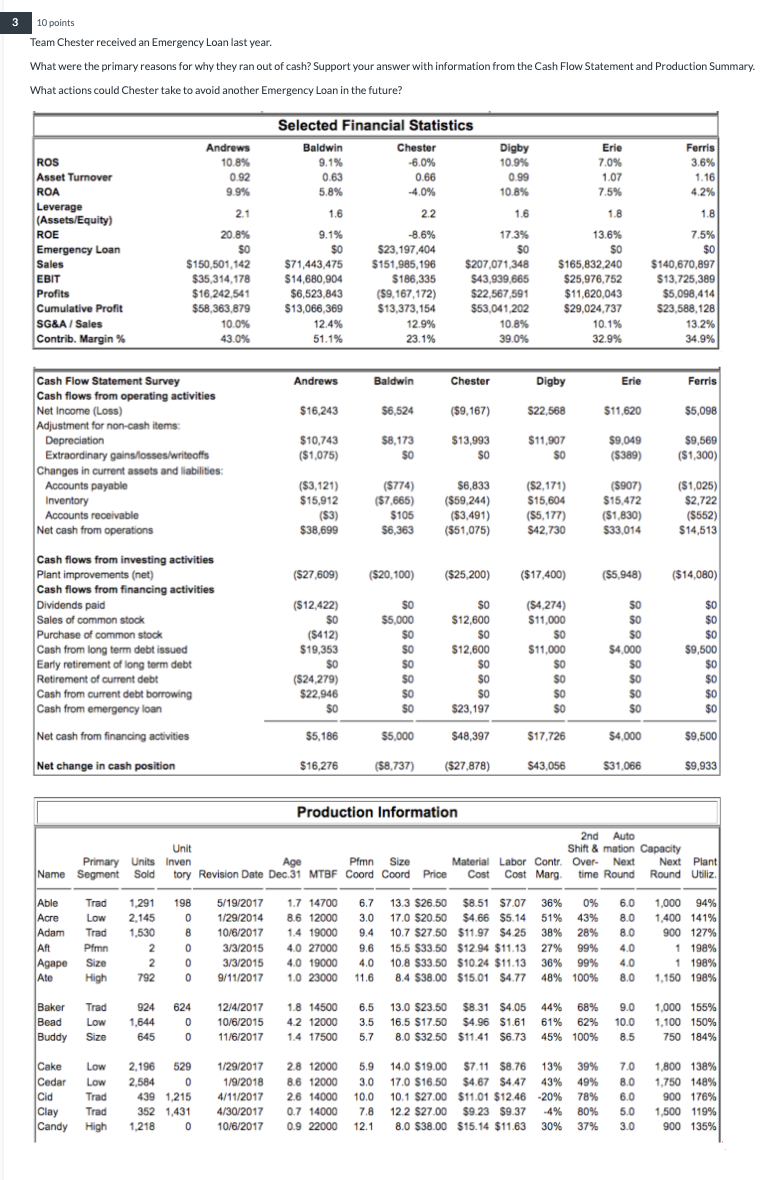
3 10 points Team Chester received an Emergency Loan last year. What were the primary reasons for why they ran out of cash? Support your answer with information from the Cash Flow Statement and Production Summary What actions could Chester take to avoid another Emergency Loan in the future? Selected Financial Statistics Erie 7.0% Andrews 10.8% 0.92 9.9% Baldwin 9.1% 0.63 5.8% Chester -6.0% 0.66 -4.0% Digby 10.9% 0.99 10.8% Ferris 3.6% 1.16 4.2% 1.07 7.5% 2.1 1.6 2.2 1.6 1.8 1.8 ROS Asset Turnover ROA Leverage (Assets/Equity) ROE Emergency Loan Sales EBIT Profits Cumulative Profit 20.8% % $0 $150,501, 142 $35,314,178 $16,242,541 $ $58,363,879 10.0% 43.0% 9.1% $0 $71,443,475 $14,680,904 $6,523,843 $13,066,369 12.4% 51.1% -8.6% $23,197,404 $151,985,196 $186,335 ($9,167,172) $13,373,154 12.9% 23.1% 17.3% $0 $207,071,348 $43,939,665 $22,567,591 $53,041,202 10.8% 39.0% 13.6% SO $165,832,240 $25,976,752 $11,620,043 $29,024,737 10.1% 32.9% 7.5% $0 $140,670,897 $13,725,389 $5,098,414 $23,588,128 13.2% 34.9% SG&A / Sales Contrib. Margin% Andrews Baldwin Chester Digby Erie Ferris $16,243 $6,524 ($9,167) $22,568 $11,620 $5,098 Cash Flow Statement Survey Cash flows from operating activities Net Income (Loss) Adjustment for non-cash items: Depreciation Extraordinary gains losses/writeoffs Changes in current assets and liabilities: Accounts payable Inventory $10,743 ($1,075) $8,173 SO $13,993 SO $11,907 SO $9.049 (5389) $9,569 ($1,300) ($3,121) $15,912 (53) $38,699 (5774) ($7,665) $105 $6,363 $ $6,833 ($59,244) ($3,491) ($51,075) ($2,171) $15,604 (55,177) $42.730 (5907) $15,472 (51,830) $33,014 ($1,025) $2,722 ($552) $14,513 Accounts receivable Net cash from operations ($27,609) ) ($20,100) ($25,200) $ ($17.400) ($5.948) ($14,080) Cash flows from investing activities Plant improvements (net) Cash flows from financing activities Dividends paid Sales of common stock Purchase of common stock Cash from long term debt issued Early retirement of long term debt Retirement of current debt Cash from current debt borrowing Cash from emergency loan ($12,422) $0 ($412) $19,353 $0 ($24.279) SO $5,000 SO $0 SO SO $0 SO SO $12,600 SO $12,600 SO SO $0 $23,197 (54.274) $11,000 $0 $11,000 $0 $0 $0 $0 $0 SO $0 $4,000 $0 $0 $0 $0 $0 $0 $0 $9,500 $0 $0 $0 $0 $22.946 $0 Net cash from financing activities $5,186 $5,000 $ $48,397 $17.726 $4,000 $9,500 Net change in cash position $16,276 ($8,737) ($27,878) $43,056 $31,066 $9,933 Production Information 2nd Auto Unit Shift & mation Capacity Primary Units Inven Age Pimn Size Material Labor Contr. Over- Next Next Plant Name Segment Sold tory Revision Date Dec 31 MTBF Coord Coord Price Cost Cost Cost Marg time Round Round Utiliz Trad 198 5/19/2017 6.0 Low 1.291 2,145 1,530 0 1/29/2014 10/6/2017 8.0 8.0 Trad B Able Acre Adam Aft Agape Ate 1.7 14700 6.7 13.3 $26.50 $8.51 $7.07 8.6 12000 3.0 17.0 $20,50 17,0 $20.50 $4.66 $5.14 1.4 19000 9.4 10.7 $27.50 $11.97 $425 4.0 27000 9.6 15.5 $33.50 $12.94 $11.13 4.0 19000 4.0 10.8 $33.50 $10.24 $11.13 1.0 23000 11.6 8.4 $38.00 $15.01 $4.77 36% 0% 51% 43% 38% 28% 27% 99% 36% 99% 48% 100% 1,000 94% 1.400 141% 900 127% 1 198% 1 198% 1,150 198% Pfmn 2 0 40 Size 2 792 0 0 3/3/2015 3/3/2015 9/11/2017 4.0 8.0 High Trad 624 9.0 Baker Bead Buddy 924 1,644 Low 0 12/4/2017 10/6/2015 11/6/2017 1.8 14500 42 12000 1.4 17500 6.5 13.0 $23.50 $8.31 $4.05 44% 68% 3.5 16.5 $17.50 $4.96 $1.61 61% 62% 5.7 8.0 $32.50 $11.41 $6.73 45% 100% 10.0 1,000 155% 1.100 150% 750 184% Size 645 0 8.5 28 12000 Cake Low Cedar Low Cid Trad Clay Trad Candy High 2,196 529 2.584 0 439 1.215 352 1,431 1.218 0 1/29/2017 1/9/2018 4/11/2017 4/30/2017 8.6 12000 26 14000 0.7 14000 0.9 22000 5.9 14,0 $19.00 $7.11 58.76 13% 39% 3.0 17.0 $16.50 $4.67 $4.47 43% 49% 10.0 10.1 $27.00 $11.01 $12.46 -20% 78% 7.8 12.2 $27.00 $9.23 $9.37 80% 12.1 8.0 $38.00 $15.14 $11.63 30% 37% 7.0 8.0 6.0 5.0 3.0 1,800 138% 1,750 148% 900 176% 1,500 119% 900 135% 10/6/2017 3 10 points Team Chester received an Emergency Loan last year. What were the primary reasons for why they ran out of cash? Support your answer with information from the Cash Flow Statement and Production Summary What actions could Chester take to avoid another Emergency Loan in the future? Selected Financial Statistics Erie 7.0% Andrews 10.8% 0.92 9.9% Baldwin 9.1% 0.63 5.8% Chester -6.0% 0.66 -4.0% Digby 10.9% 0.99 10.8% Ferris 3.6% 1.16 4.2% 1.07 7.5% 2.1 1.6 2.2 1.6 1.8 1.8 ROS Asset Turnover ROA Leverage (Assets/Equity) ROE Emergency Loan Sales EBIT Profits Cumulative Profit 20.8% % $0 $150,501, 142 $35,314,178 $16,242,541 $ $58,363,879 10.0% 43.0% 9.1% $0 $71,443,475 $14,680,904 $6,523,843 $13,066,369 12.4% 51.1% -8.6% $23,197,404 $151,985,196 $186,335 ($9,167,172) $13,373,154 12.9% 23.1% 17.3% $0 $207,071,348 $43,939,665 $22,567,591 $53,041,202 10.8% 39.0% 13.6% SO $165,832,240 $25,976,752 $11,620,043 $29,024,737 10.1% 32.9% 7.5% $0 $140,670,897 $13,725,389 $5,098,414 $23,588,128 13.2% 34.9% SG&A / Sales Contrib. Margin% Andrews Baldwin Chester Digby Erie Ferris $16,243 $6,524 ($9,167) $22,568 $11,620 $5,098 Cash Flow Statement Survey Cash flows from operating activities Net Income (Loss) Adjustment for non-cash items: Depreciation Extraordinary gains losses/writeoffs Changes in current assets and liabilities: Accounts payable Inventory $10,743 ($1,075) $8,173 SO $13,993 SO $11,907 SO $9.049 (5389) $9,569 ($1,300) ($3,121) $15,912 (53) $38,699 (5774) ($7,665) $105 $6,363 $ $6,833 ($59,244) ($3,491) ($51,075) ($2,171) $15,604 (55,177) $42.730 (5907) $15,472 (51,830) $33,014 ($1,025) $2,722 ($552) $14,513 Accounts receivable Net cash from operations ($27,609) ) ($20,100) ($25,200) $ ($17.400) ($5.948) ($14,080) Cash flows from investing activities Plant improvements (net) Cash flows from financing activities Dividends paid Sales of common stock Purchase of common stock Cash from long term debt issued Early retirement of long term debt Retirement of current debt Cash from current debt borrowing Cash from emergency loan ($12,422) $0 ($412) $19,353 $0 ($24.279) SO $5,000 SO $0 SO SO $0 SO SO $12,600 SO $12,600 SO SO $0 $23,197 (54.274) $11,000 $0 $11,000 $0 $0 $0 $0 $0 SO $0 $4,000 $0 $0 $0 $0 $0 $0 $0 $9,500 $0 $0 $0 $0 $22.946 $0 Net cash from financing activities $5,186 $5,000 $ $48,397 $17.726 $4,000 $9,500 Net change in cash position $16,276 ($8,737) ($27,878) $43,056 $31,066 $9,933 Production Information 2nd Auto Unit Shift & mation Capacity Primary Units Inven Age Pimn Size Material Labor Contr. Over- Next Next Plant Name Segment Sold tory Revision Date Dec 31 MTBF Coord Coord Price Cost Cost Cost Marg time Round Round Utiliz Trad 198 5/19/2017 6.0 Low 1.291 2,145 1,530 0 1/29/2014 10/6/2017 8.0 8.0 Trad B Able Acre Adam Aft Agape Ate 1.7 14700 6.7 13.3 $26.50 $8.51 $7.07 8.6 12000 3.0 17.0 $20,50 17,0 $20.50 $4.66 $5.14 1.4 19000 9.4 10.7 $27.50 $11.97 $425 4.0 27000 9.6 15.5 $33.50 $12.94 $11.13 4.0 19000 4.0 10.8 $33.50 $10.24 $11.13 1.0 23000 11.6 8.4 $38.00 $15.01 $4.77 36% 0% 51% 43% 38% 28% 27% 99% 36% 99% 48% 100% 1,000 94% 1.400 141% 900 127% 1 198% 1 198% 1,150 198% Pfmn 2 0 40 Size 2 792 0 0 3/3/2015 3/3/2015 9/11/2017 4.0 8.0 High Trad 624 9.0 Baker Bead Buddy 924 1,644 Low 0 12/4/2017 10/6/2015 11/6/2017 1.8 14500 42 12000 1.4 17500 6.5 13.0 $23.50 $8.31 $4.05 44% 68% 3.5 16.5 $17.50 $4.96 $1.61 61% 62% 5.7 8.0 $32.50 $11.41 $6.73 45% 100% 10.0 1,000 155% 1.100 150% 750 184% Size 645 0 8.5 28 12000 Cake Low Cedar Low Cid Trad Clay Trad Candy High 2,196 529 2.584 0 439 1.215 352 1,431 1.218 0 1/29/2017 1/9/2018 4/11/2017 4/30/2017 8.6 12000 26 14000 0.7 14000 0.9 22000 5.9 14,0 $19.00 $7.11 58.76 13% 39% 3.0 17.0 $16.50 $4.67 $4.47 43% 49% 10.0 10.1 $27.00 $11.01 $12.46 -20% 78% 7.8 12.2 $27.00 $9.23 $9.37 80% 12.1 8.0 $38.00 $15.14 $11.63 30% 37% 7.0 8.0 6.0 5.0 3.0 1,800 138% 1,750 148% 900 176% 1,500 119% 900 135% 10/6/2017