

Answered step by step
Verified Expert Solution
Question
1 Approved Answer
3 2 0 points Use the 'Kings County Home Sales' worksheet to craete two separate pivot tables and charts in two new sheets titled SQFT
points
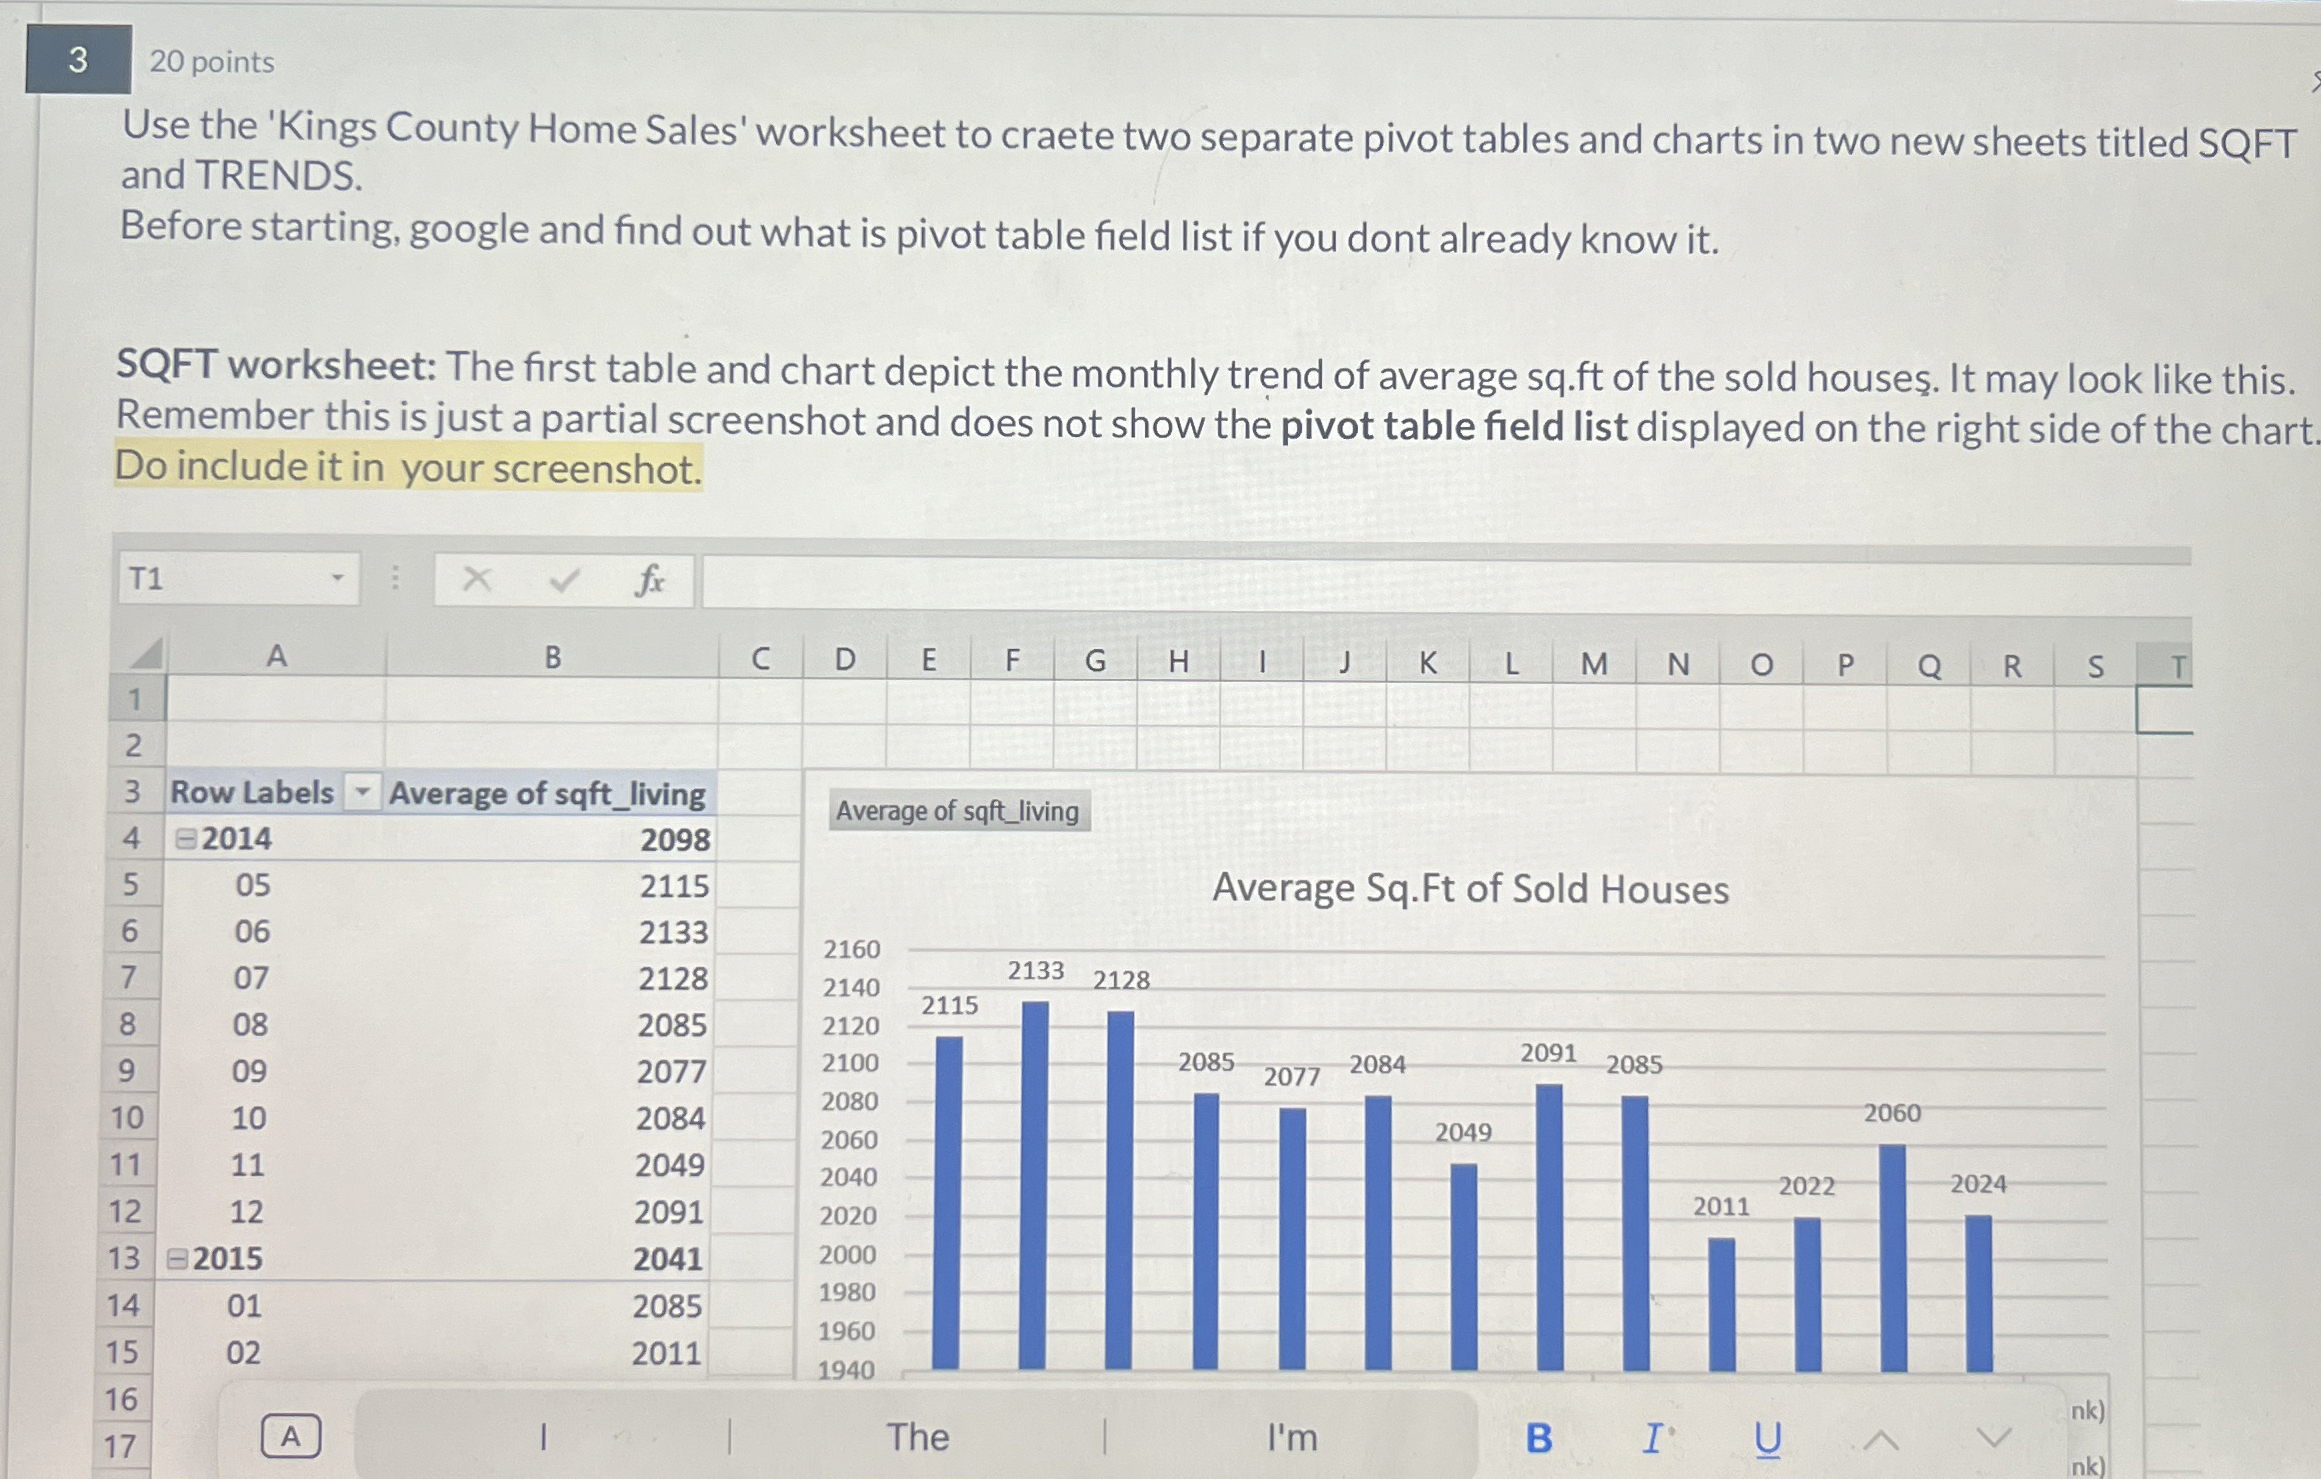
Use the 'Kings County Home Sales' worksheet to craete two separate pivot tables and charts in two new sheets titled SQFT and TRENDS.
Before starting, google and find out what is pivot table field list if you dont already know it
SQFT worksheet: The first table and chart depict the monthly trend of average sqft of the sold houses. It may look like this. Remember this is just a partial screenshot and does not show the pivot table field list displayed on the right side of the chart Do include it in your screenshot.
Step by Step Solution
There are 3 Steps involved in it
Step: 1

Get Instant Access to Expert-Tailored Solutions
See step-by-step solutions with expert insights and AI powered tools for academic success
Step: 2

Step: 3
Ace Your Homework with AI
Get the answers you need in no time with our AI-driven, step-by-step assistance
Get Started
Database Concepts
Authors: David M. Kroenke, David J. Auer
7th edition
133544621, 133544626, 0-13-354462-1, 978-0133544626