Answered step by step
Verified Expert Solution
Link Copied!

Question

1 Approved Answer

3. (20 pts, no explanation required) Consider the graph of the piecewise function y = f (x) pictured below. (a) State the value of f
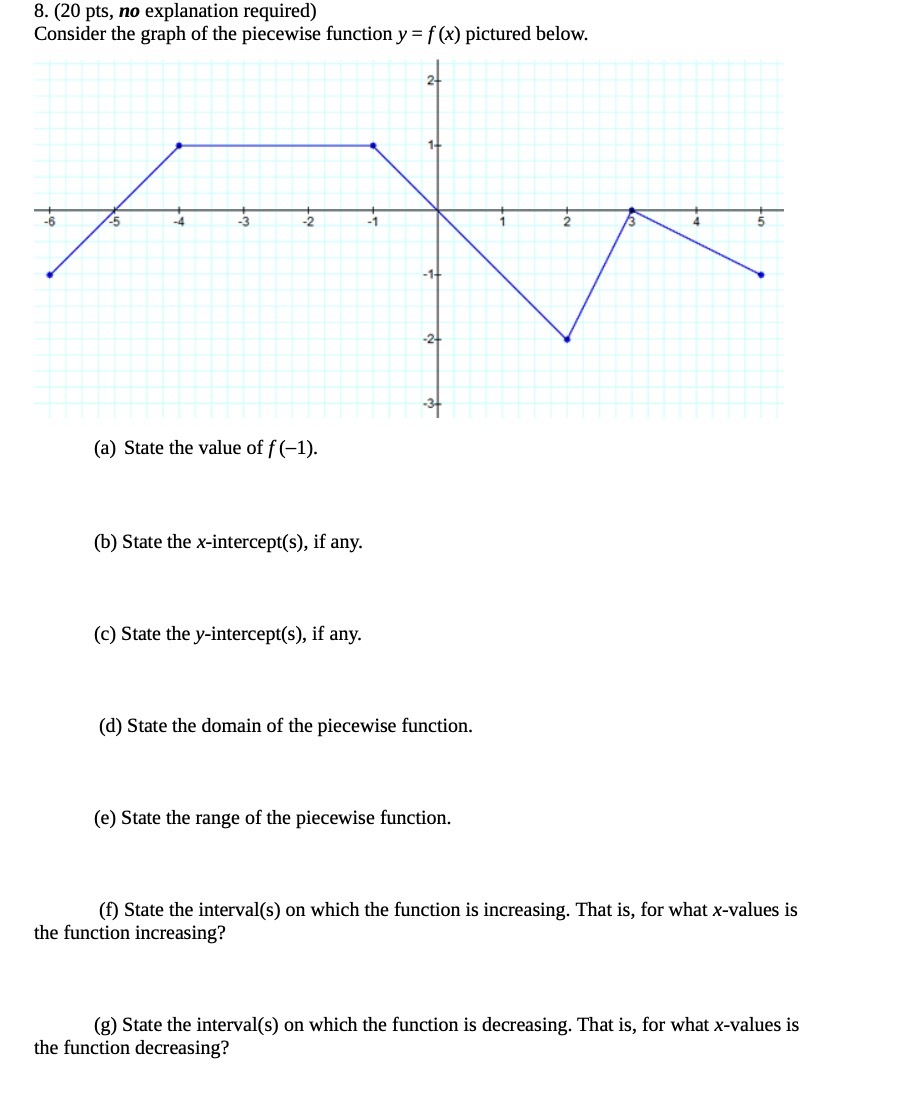
image text in transcribed
3. (20 pts, no explanation required) Consider the graph of the piecewise function y = f (x) pictured below. (a) State the value of f (1). (b) State the xintel'cept(s}, if any. (c) State the yintercept{s}, if any. (d) State the domain of the piecewise function. (e) State the range of the piecewise function. (f) State the interva](s) on which the function is increasing. That is, for what xvalues is the function increasing? {g} State the interva1(s) on which the function is decreasing. That is, for what xvalues is the function decreasing

Step by Step Solution

There are 3 Steps involved in it

Step: 1

blur-text-image

Get Instant Access to Expert-Tailored Solutions

See step-by-step solutions with expert insights and AI powered tools for academic success

Step: 2

blur-text-image

Step: 3

blur-text-image

Ace Your Homework with AI

Get the answers you need in no time with our AI-driven, step-by-step assistance

Get Started

Recommended Textbook for

Derivatives Markets

Authors: Robert McDonald

3rd Edition

978-9332536746, 9789332536746

Students also viewed these Mathematics questions

Question

=+How does the eclectic theory influence management practice?

Answered: 1 week ago