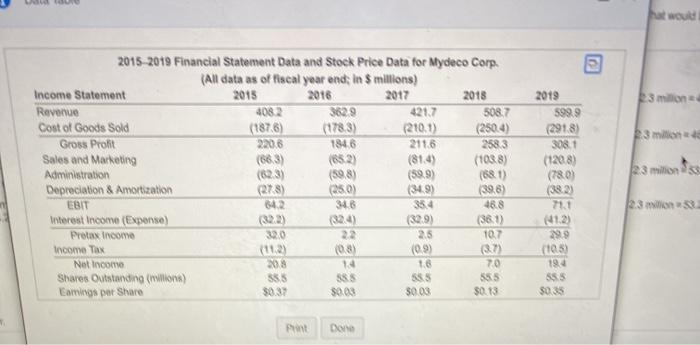
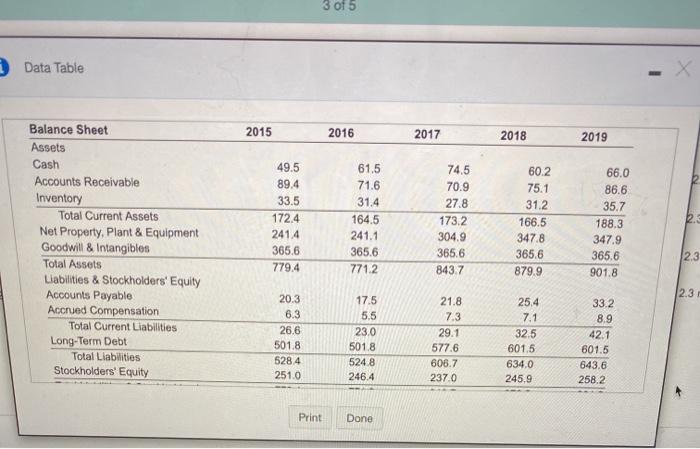
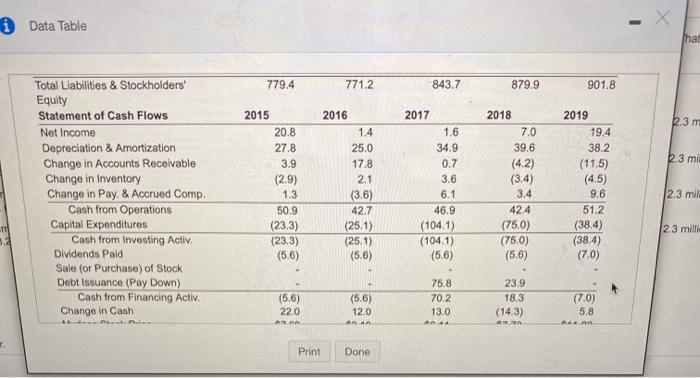
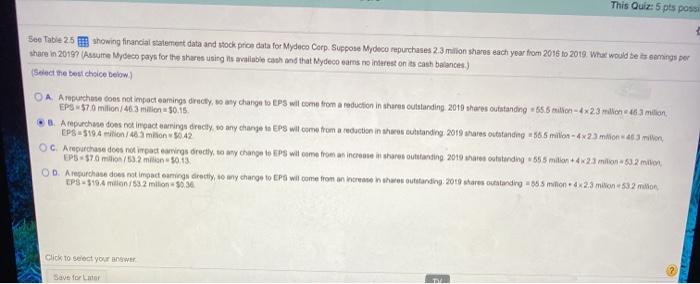
3 2019 5999 3 milion 2015 2019 Financial Statement Data and Stock Price Data for Mydeco Corp. (All data as of fiscal year end; in $ millions) Income Statement 2015 2016 2017 2018 Revenue 4082 3629 421.7 508.7 Cost of Goods Sold (1876) (178.3) (210.1) (2504 Gross Prolit 2206 1846 211.6 2583 Sales and Marketing (663) (1038) Administration (623) (598) (599) (681) Depreciation & Amortization 278) (250) (349) EBIT 642 34.8 35.4 468 Werest Income (Expense) (329) (361) Protax income 320 2.5 107 Income Tax (08) (0.9) Not Income 208 14 1.0 70 Shares Outstanding (none) 385 388 S85 555 Emig per Share 3837 S003 5003 $0.13 3081 (1208) (780) 23 milions 23 71.1 (12) 299 (105) 194 555 Done 3 of 5 Data Table 2015 2016 2017 2018 2019 Balance Sheet Assets Cash Accounts Receivable Inventory Total Current Assets Net Property, Plant & Equipment Goodwill & Intangibles Total Assets Liabilities & Stockholders' Equity Accounts Payable Accrued Compensation Total Current Liabilities Long-Term Debt Total Liabilities Stockholders' Equity 49.5 89.4 33.5 172.4 241.4 365.6 779.4 61.5 71.6 31.4 164.5 241.1 365.6 771.2 74,5 70.9 27.8 173,2 304.9 365.6 843.7 60.2 75.1 31.2 166.5 347.8 365.6 879.9 66.0 86.6 35.7 188.3 347.9 365.6 901.8 23 2.3 33.2 8.9 20.3 6.3 26.6 501.8 528.4 251.0 17.5 5.5 23.0 501.8 524.8 246.4 21.8 7.3 29.1 577.6 606.7 2370 25.4 7.1 32.5 601.5 634.0 245.9 42.1 601.5 643.6 258.2 Print Done i Data Table that 779.4 771.2. 843.7 879.9 901.8 2016 2017 2015 20.8 2.3 m 1.4 1.6 27.8 2.3 mi Total Liabilities & Stockholders' Equity Statement of Cash Flows Net Income Depreciation & Amortization Change in Accounts Receivable Change in Inventory Change in Pay. & Accrued Comp. Cash from Operations Capital Expenditures Cash from Investing Activ Dividends Paid Sale (or Purchase) of Stock Debt Issuance (Pay Down) Cash from Financing Activ Change in Cash 3.9 (2.9) 1.3 50.9 (23.3) (23.3) (56) 25.0 17.8 2.1 (3.6) 42.7 (25.1) (25.1) (5.6) 2.3 mil 2018 7.0 39.6 (4.2) (3.4) 3,4 42.4 (750) (750) (5.6) 34.9 0.7 3.6 6.1 46.9 (104.1) (104.1) (56) 2019 19.4 38.2 (11.5) (4.5) 9.6 51.2 (38.4) (38.4) (7.0) 2.3 milli 5. (5.6) 22.0 (5.6) 12.0 75.8 70.2 13.0 23.9 18.3 (14.3) (7.0) 5.8 RA AA 44 A 44 1. Print Done Cash from Financing Activ. Change in Cash Mydeco Stock Price (5.6) 22.0 $7.68 (5.6) 12.0 $3.19 70.2 13.0 $6.11 18.3 (14.3) $7.73 (7.0) 5.8 $11.82 Print Done This Quiz: 5 pts poss Bee Table 25 showing financial statement data and stock prion data for Mydeco Corp. Suppose Mydeco repurchases 2.3 milion shares each year from 2016 to 2019. What would be is camins per share in 20199 Asutne Mydeco pays for the shares using its weible cash and that Mydeco carns no interest on its cash balances) Select the best choice below) OA Arputhane cont not impact oaming directly to any change to EPS will come from a reduction in shores outstanding 2010 shares outstanding 65.5 million - 4x2.3 milioni 1.3 million EPS 570 milion/46.3 milion $0.15 *. A purchase does not incat saring deacty, to any change is EPs will come from a reduction in theros chtunding 2019 shares outstanding + 58.6 millon - 423 milion 463 milion EPS5194/483 million 3042 OC. Arepurchase does not impact earnings directly to my change to EPs will come from an increase in the souttanding 2019 secututinding 665 millon 4x23 milion 63.2 non EPS 570 mi/52 milion 5013 00. Arouchate does not most coming drasty, to my change to Po will come from an increase in the outstanding 2018 hores outstanding stond 2.3 milion 53.2 milion LPS 319,4 milo/532 milion Click to select your new Save for Later TY
