Answered step by step
Verified Expert Solution
Question
1 Approved Answer
3. (20p) Assume that you manage a dry cleaning business. Using the regression analysis tool in Excel to estimate your firm's demand curve (for

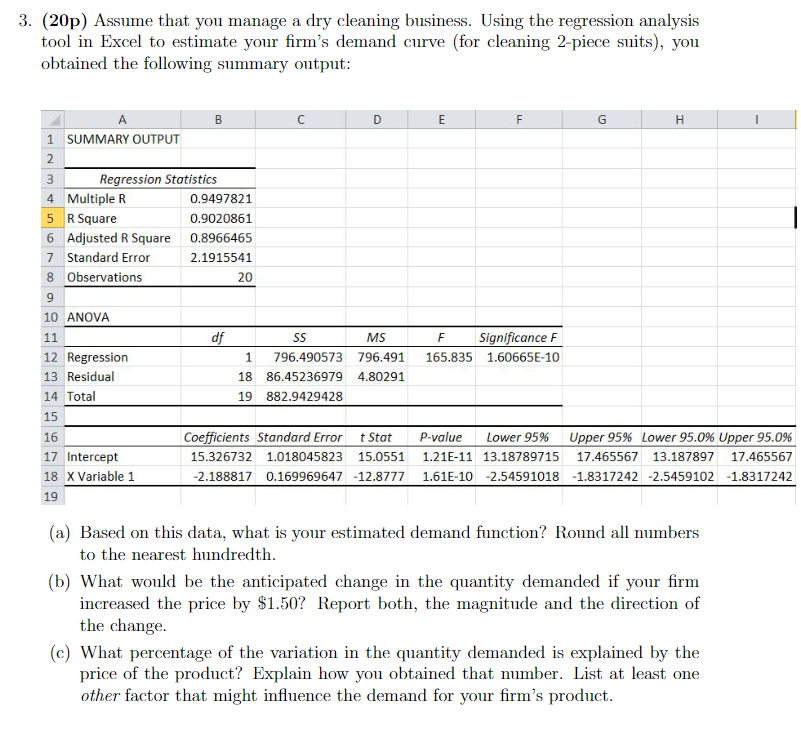
3. (20p) Assume that you manage a dry cleaning business. Using the regression analysis tool in Excel to estimate your firm's demand curve (for cleaning 2-piece suits), you obtained the following summary output: A 1 SUMMARY OUTPUT 2 Regression Statistics B C D E F G H 3 4 Multiple R 0.9497821 5 R Square 0.9020861 6 Adjusted R Square 0.8966465 7 Standard Error 2.1915541 8 Observations 20 9 10 ANOVA 11 df 12 Regression SS MS F 165.835 Significance F 1.60665E-10 1 796.490573 796.491 13 Residual 18 14 Total 86.45236979 4.80291 19 882.9429428 15 16 Coefficients Standard Error 17 Intercept 15.326732 1.018045823 t Stat P-value 15.0551 1.21E-11 18 X Variable 1 19 Upper 95% Lower 95.0% Upper 95.0% 17.465567 13.187897 17.465567 -2.188817 0.169969647 -12.8777 1.61E-10 -2.54591018 -1.8317242 -2.5459102 -1.8317242 Lower 95% 13.18789715 (a) Based on this data, what is your estimated demand function? Round all numbers to the nearest hundredth. (b) What would be the anticipated change in the quantity demanded if your firm increased the price by $1.50? Report both, the magnitude and the direction of the change. (c) What percentage of the variation in the quantity demanded is explained by the price of the product? Explain how you obtained that number. List at least one other factor that might influence the demand for your firm's product.
Step by Step Solution
There are 3 Steps involved in it
Step: 1

Get Instant Access to Expert-Tailored Solutions
See step-by-step solutions with expert insights and AI powered tools for academic success
Step: 2

Step: 3

Ace Your Homework with AI
Get the answers you need in no time with our AI-driven, step-by-step assistance
Get Started


