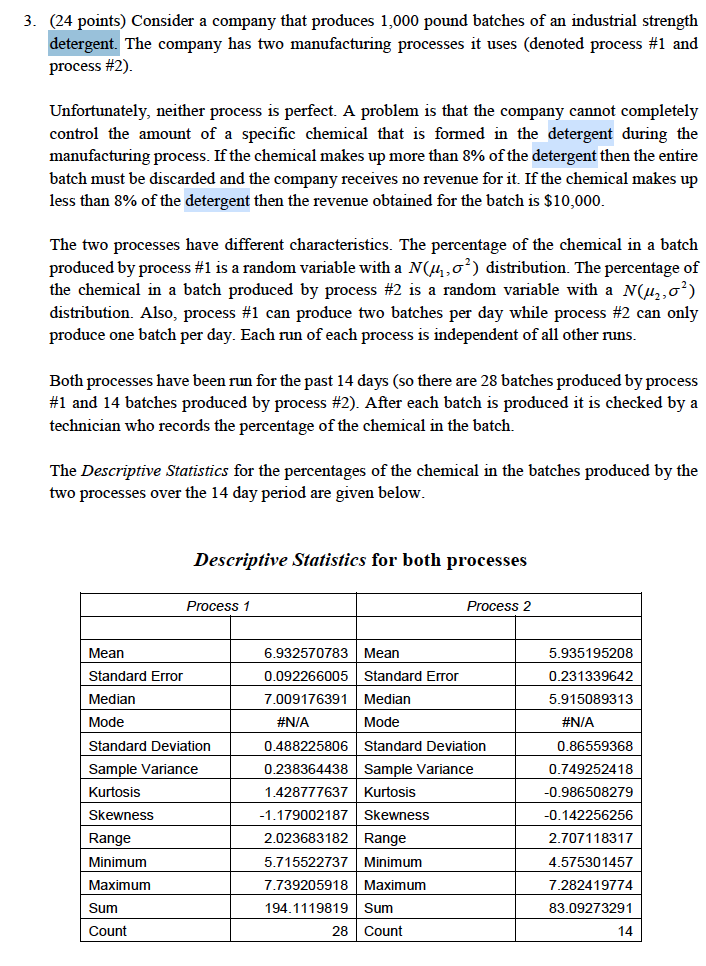
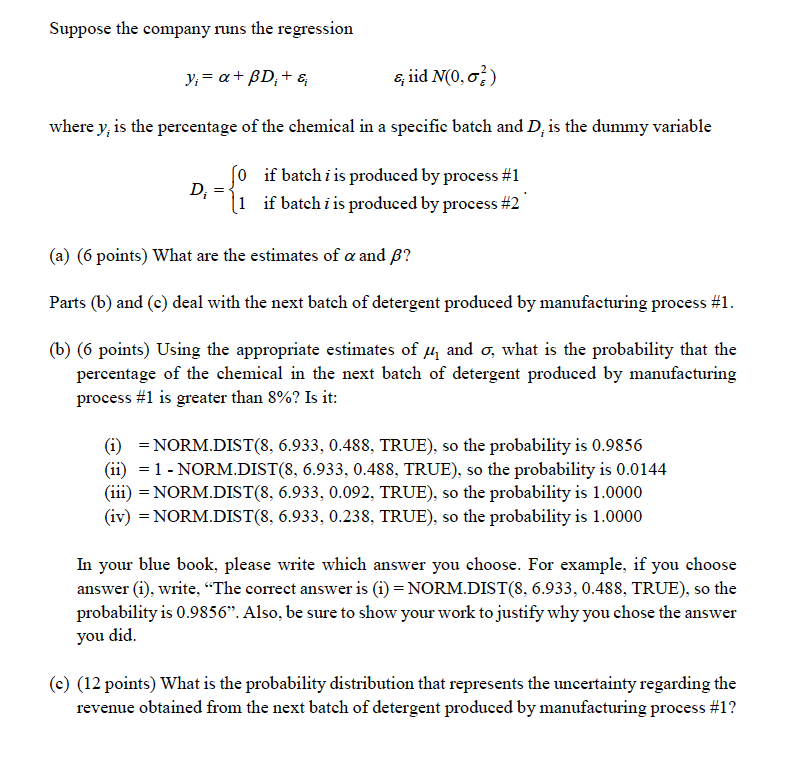
3. (24 points) Consider a company that produces 1,000 pound batches of an industrial strength detergent. The company has two manufacturing processes it uses (denoted process #1 and process #2). Unfortunately, neither process is perfect. A problem is that the company cannot completely control the amount of a specific chemical that is formed in the detergent during the manufacturing process. If the chemical makes up more than 8% of the detergent then the entire batch must be discarded and the company receives no revenue for it. If the chemical makes up less than 8% of the detergent then the revenue obtained for the batch is $10,000. The two processes have different characteristics. The percentage of the chemical in a batch produced by process #1 is a random variable with a N(/4 , ) distribution. The percentage of the chemical in a batch produced by process #2 is a random variable with a N(2,o') distribution. Also, process #1 can produce two batches per day while process #2 can only produce one batch per day. Each run of each process is independent of all other runs. Both processes have been run for the past 14 days (so there are 28 batches produced by process #1 and 14 batches produced by process #2). After each batch is produced it is checked by a technician who records the percentage of the chemical in the batch. The Descriptive Statistics for the percentages of the chemical in the batches produced by the two processes over the 14 day period are given below. Descriptive Statistics for both processes Process 1 Process 2 Mean 6.932570783 Mean 5.935195208 Standard Error 0.092266005 Standard Error 0.231339642 Median 7.009176391 Median 5.915089313 Mode #N/A Mode #N/A Standard Deviation 0.488225806 Standard Deviation 0.86559368 Sample Variance 0.238364438 Sample Variance 0.749252418 Kurtosis 1.428777637 Kurtosis 0.986508279 Skewness -1.179002187 Skewness -0.142256256 Range 2.023683182 Range 2.707118317 Minimum 5.715522737 Minimum 4.575301457 Maximum 7.739205918 Maximum 7.282419774 Sum 194.1119819 Sum 83.09273291 Count 28 Count 14Suppose the company runs the regression ys=a+Dr+s siidN(0,cr) where y, is the percentage of the chemical in a specic batch and D, is the dummy variable _ 0 if batch 1' is produced by process #1 i 1 if batch f is produced by process #2 I (a) (6 points) What are the estimates of brand ,8? Parts (b) and (c) deal with the next batch of detergent produced by manufacturing process #1. (b) (6 points) Using the appropriate estimates of Jul and (I, what is the probability that the percentage of the chemical in the next batch of detergent produced by manufacturing process #1 is greater than 8%? Is it: (i) = NORM.DIST(8, 6.933, 0.488, TRUE), so the probability is 0.9856 (ii) = l - NORM.DIST(8, 6.93 3, 0.488, TRUE), so the probability is 0.0144 (iii) = NORM.DIST(8, 6.933, 0.092, TRUE}, so the probability is 1.0000 (iv) = NORM.DIST(8, 6.933, 0.238, TRUE}, so the probability is 1.0000 In your blue book, please write which answer you choose. For example, if you choose answer (i), write, \"The correct answer is (i) = NORM.DIST(8, 6.933, 0.483, TRUE), so the probability is 0.9856\". Also, be sure to show your work to justify why you chose the answer you did. (c) (12 points} What is the probability distribution that represents the uncertainty regarding the revenue obtained from the next batch of detergent produced by manufacturing process #1