

Answered step by step
Verified Expert Solution
Question
1 Approved Answer
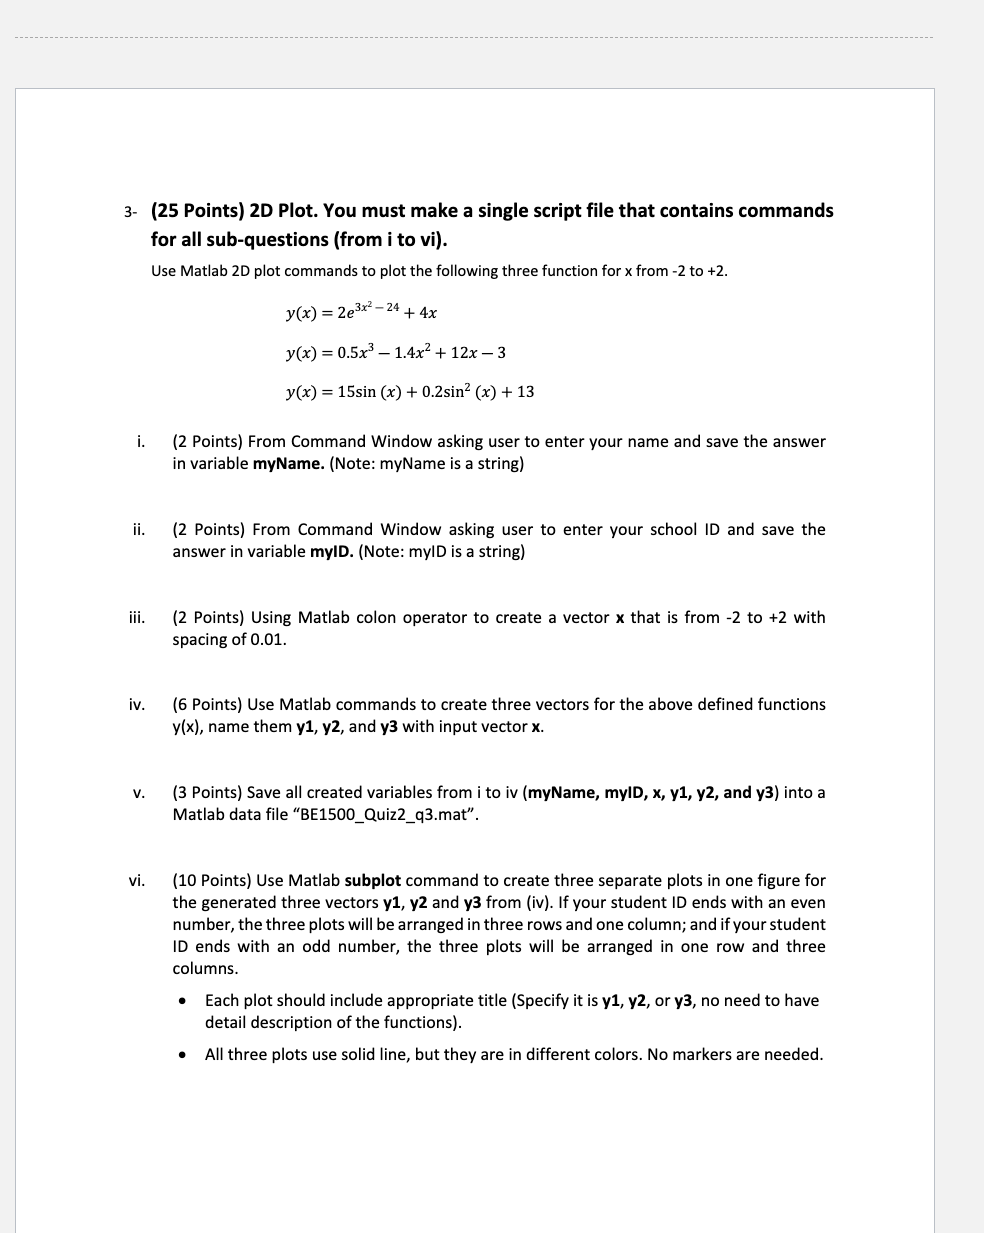
3- (25 Points) 2D Plot. You must make a single script file that contains commands for all sub-questions (from i to vi). Use Matlab 2D
Step by Step Solution
There are 3 Steps involved in it
Step: 1

Get Instant Access to Expert-Tailored Solutions
See step-by-step solutions with expert insights and AI powered tools for academic success
Step: 2

Step: 3
Ace Your Homework with AI
Get the answers you need in no time with our AI-driven, step-by-step assistance
Get Started
Advances In Knowledge Discovery In Databases
Authors: Animesh Adhikari, Jhimli Adhikari
1st Edition
3319132121, 9783319132129