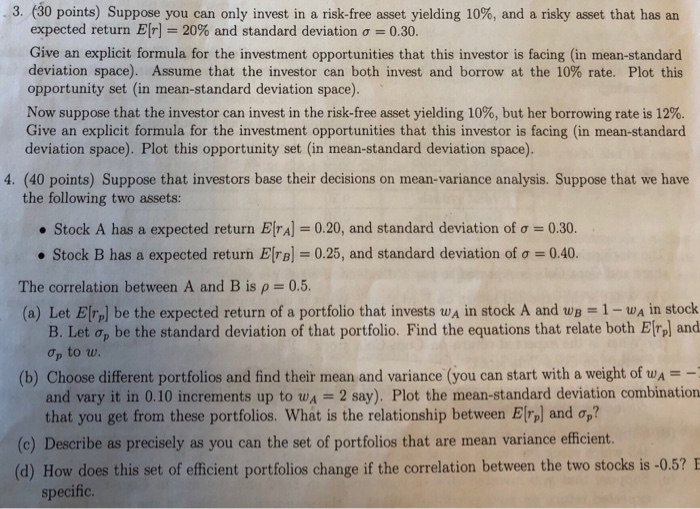
3. (30 points) Suppose you can only invest in a risk-free asset yielding 10%, and a risky asset that has an expected return E[r] =20% and standard deviation o = 0.30. Give an explicit formula for the investment opportunities that this investor is facing (in mean-standard deviation space). Assume that the investor can both invest and borrow at the 10% rate. Plot this opportunity set (in mean-standard deviation space). Now suppose that the investor can invest in the risk-free asset yielding 10%, but her borrowing rate is 12%. Give an explicit formula for the investment opportunities that this investor is facing (in mean-standard deviation space). Plot this opportunity set (in mean-standard deviation space). 4. (40 points) Suppose that investors base their decisions on mean-variance analysis. Suppose that we have the following two assets: Stock A has a expected return E[ra] = 0.20, and standard deviation of o = 0.30. Stock B has a expected return E[TB] = 0.25, and standard deviation of o = 0.40. The correlation between A and B is p=0.5. (a) Let Er be the expected return of a portfolio that invests wa in stock A and we = 1 - WA in stock B. Let op be the standard deviation of that portfolio. Find the equations that relate both Erp) and Op to w. (b) Choose different portfolios and find their mean and variance (you can start with a weight of wa= -1 and vary it in 0.10 increments up to wx = 2 say). Plot the mean-standard deviation combination that you get from these portfolios. What is the relationship between Erp and op? (c) Describe as precisely as you can the set of portfolios that are mean variance efficient. (d) How does this set of efficient portfolios change if the correlation between the two stocks is -0.5? E specific. 3. (30 points) Suppose you can only invest in a risk-free asset yielding 10%, and a risky asset that has an expected return E[r] =20% and standard deviation o = 0.30. Give an explicit formula for the investment opportunities that this investor is facing (in mean-standard deviation space). Assume that the investor can both invest and borrow at the 10% rate. Plot this opportunity set (in mean-standard deviation space). Now suppose that the investor can invest in the risk-free asset yielding 10%, but her borrowing rate is 12%. Give an explicit formula for the investment opportunities that this investor is facing (in mean-standard deviation space). Plot this opportunity set (in mean-standard deviation space). 4. (40 points) Suppose that investors base their decisions on mean-variance analysis. Suppose that we have the following two assets: Stock A has a expected return E[ra] = 0.20, and standard deviation of o = 0.30. Stock B has a expected return E[TB] = 0.25, and standard deviation of o = 0.40. The correlation between A and B is p=0.5. (a) Let Er be the expected return of a portfolio that invests wa in stock A and we = 1 - WA in stock B. Let op be the standard deviation of that portfolio. Find the equations that relate both Erp) and Op to w. (b) Choose different portfolios and find their mean and variance (you can start with a weight of wa= -1 and vary it in 0.10 increments up to wx = 2 say). Plot the mean-standard deviation combination that you get from these portfolios. What is the relationship between Erp and op? (c) Describe as precisely as you can the set of portfolios that are mean variance efficient. (d) How does this set of efficient portfolios change if the correlation between the two stocks is -0.5? E specific


