Answered step by step
Verified Expert Solution
Question
1 Approved Answer
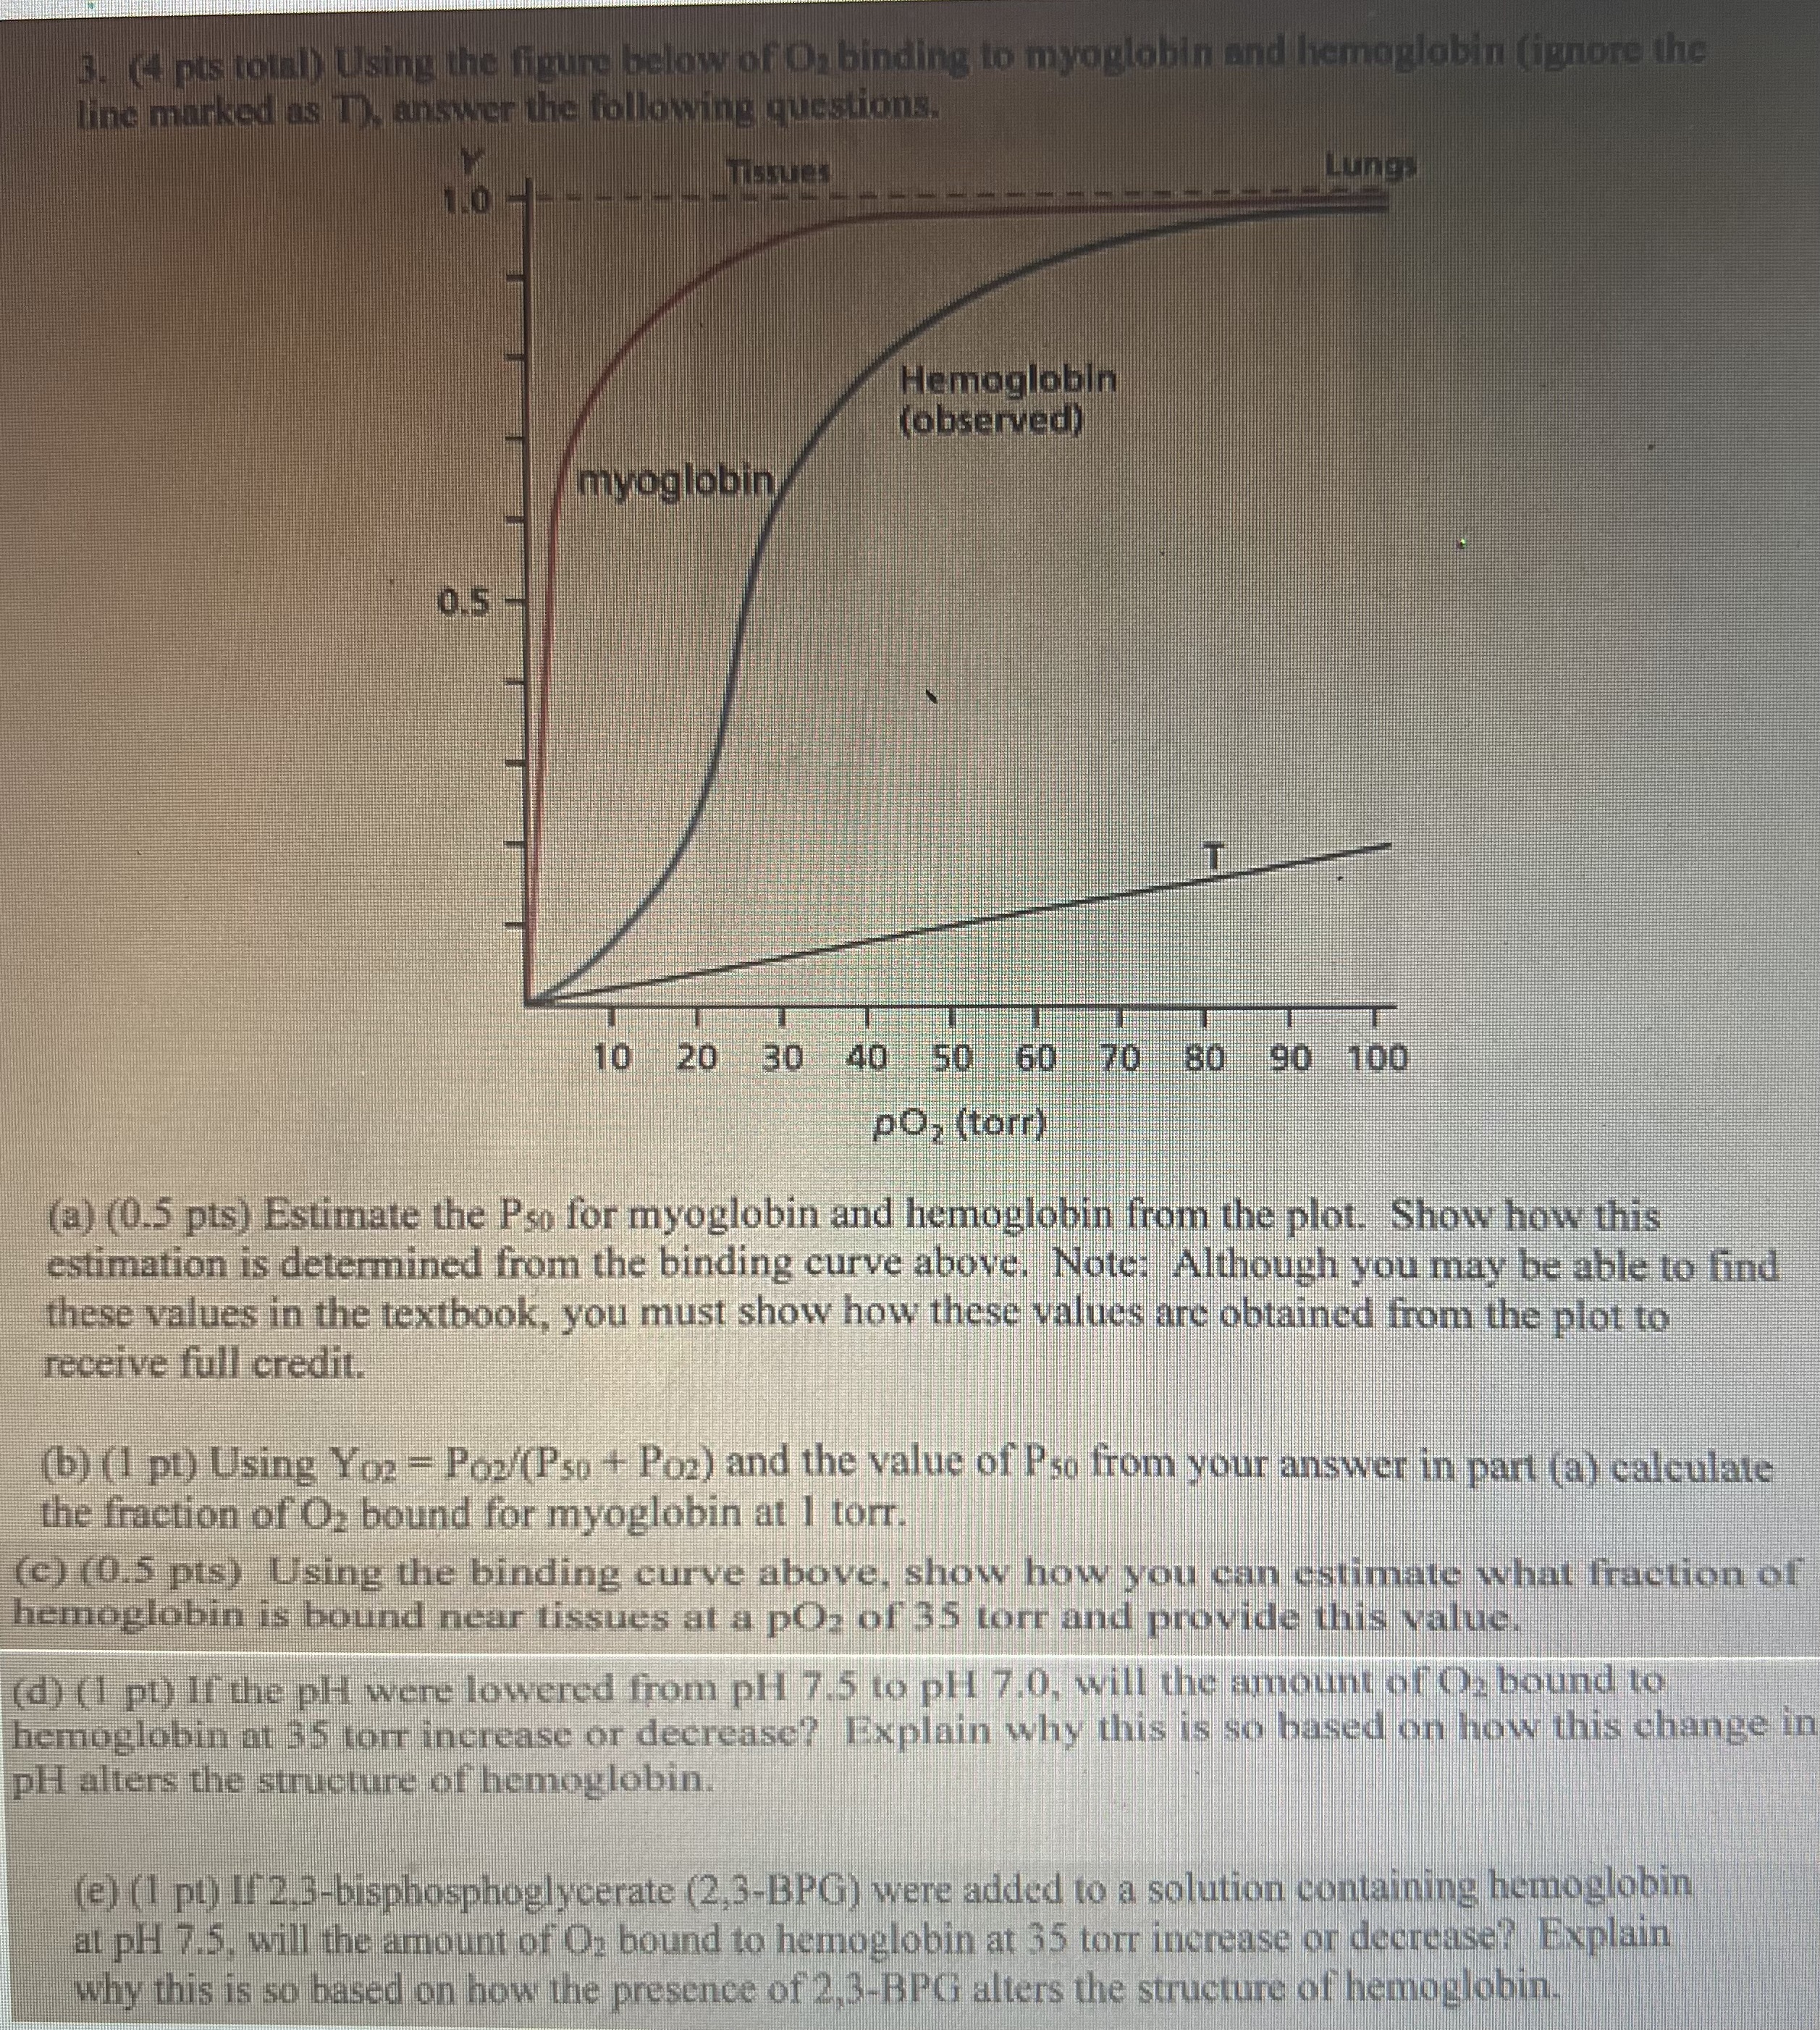
3 . ( 4 pts total ) Using the figure below of O 2 binding to myoglobin and hemoglobin ( ignore the line marked as
pts total Using the figure below of O binding to myoglobin and hemoglobin ignore the line marked as T answer the following questions.
myoglobin
a pts Estimate the P for myoglobin and hemoglobin from the plot. Show how this estimation is determined from the binding curve above. Note: Although you may be able to find these values in the textbook, you must show how these values are obtained from the plot to receive full credit.
b pt Using YO POP PO and the value of P from your answer in part a calculate the fraction of O bound for myoglobin at torr.
Assignment A BCH
c pts Using the binding curve above, show how you can estimate what fraction of hemoglobin is bound near tissues at a pO of torr and provide this value.
d pt If the pH were lowered from pH to pH will the amount of O bound to hemoglobin at torr increase or decrease? Explain why this is so based on how this change in pH alters the structure of hemoglobin.
e pt If bisphosphoglycerate BPG were added to a solution containing hemoglobin at pH will the amount of O bound to hemoglobin at torr increase or decrease? Explain why this is so based on how the presence of BPG alters the structure of hemoglobin.

Step by Step Solution
There are 3 Steps involved in it
Step: 1

Get Instant Access to Expert-Tailored Solutions
See step-by-step solutions with expert insights and AI powered tools for academic success
Step: 2

Step: 3

Ace Your Homework with AI
Get the answers you need in no time with our AI-driven, step-by-step assistance
Get Started


