

Answered step by step
Verified Expert Solution
Question
1 Approved Answer
3. A CT signal x() is shown in the figure. Sketch each of the following signals. (a) (01-0 (b) (9[:( - (t-1)] (c) 400(t- 2
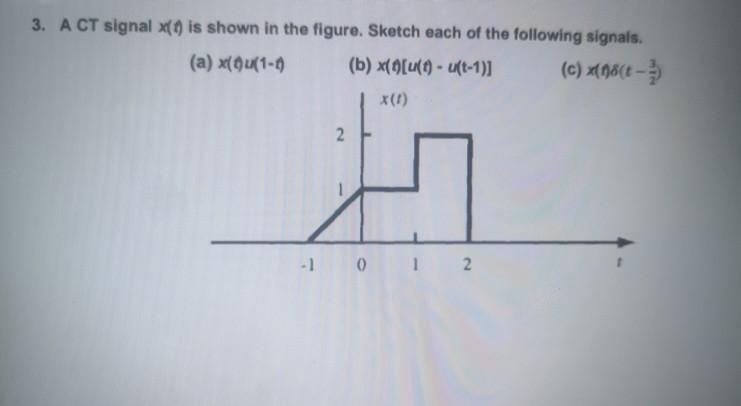
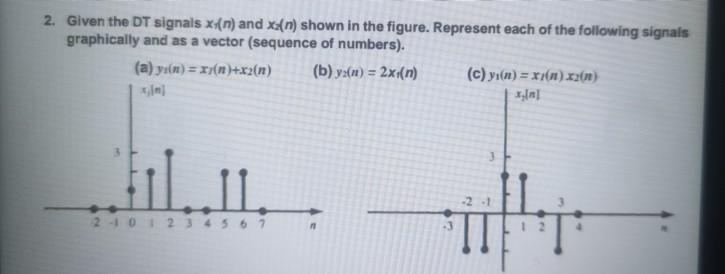
3. A CT signal x() is shown in the figure. Sketch each of the following signals. (a) (01-0 (b) (9[:( - (t-1)] (c) 400(t- 2 -1 0 1 2 2. Given the DT signals xi{n) and X:{n) shown in the figure. Represent each of the following signals graphically and as a vector (sequence of numbers). (a) ya(n) = xy(n)+x2(n) (b) y=(n) = 2x(n) (c) y(n) = x1(n) x2) -2 -1 2101 2 3 4 5 6 7 -3
Step by Step Solution
There are 3 Steps involved in it
Step: 1

Get Instant Access to Expert-Tailored Solutions
See step-by-step solutions with expert insights and AI powered tools for academic success
Step: 2

Step: 3
Ace Your Homework with AI
Get the answers you need in no time with our AI-driven, step-by-step assistance
Get Started
PC Magazine Guide To Client Server Databases
Authors: Joe Salemi
1st Edition
156276070X, 978-1562760700