

Question
3. A quality analyst wants to construct a sample mean chart for controlling a packaging process. He knows from past experience that when the process
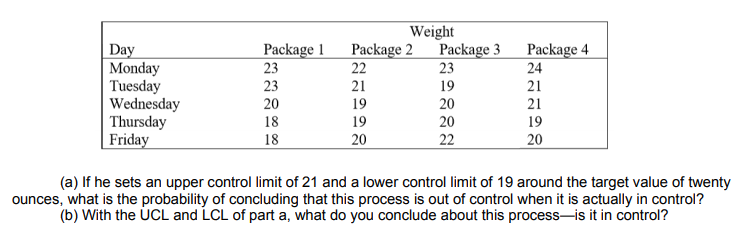
3. A quality analyst wants to construct a sample mean chart for controlling a packaging process. He knows from past experience that when the process is operating as intended, packaging weight is normally distributed with a mean of twenty ounces, and a process standard deviation of two ounces. Each day last week, he randomly selected four packages and weighed each. The data from that activity appears below.
hi
Step by Step Solution
There are 3 Steps involved in it
Step: 1

Get Instant Access to Expert-Tailored Solutions
See step-by-step solutions with expert insights and AI powered tools for academic success
Step: 2

Step: 3
Ace Your Homework with AI
Get the answers you need in no time with our AI-driven, step-by-step assistance
Get Started
Intermediate Algebra With Trigonometry
Authors: Charles P McKeague
1st Edition
1483218759, 9781483218755