Question
3.) An analyst is comparing the performance of two manufacturing competitors, Amcor Corp. and Bemis Inc. Amcor has a Return on Equity (ROE) equal to
3.) An analyst is comparing the performance of two manufacturing competitors, Amcor Corp. and Bemis Inc. Amcor has a Return on Equity (ROE) equal to 24%, while Bemis has a ROE of 15% during the same year. Both firms have a total debt to total assets ratio (D/TA) equal to 0.8, while Amcor as an asset turnover ratio of 0.9 and Bemis has an asset turnover ratio equal to 0.4
a. Calculate and compare the profit margins of Amcor and Bemis.
b. If Bemis has $100 million in inventories, a current ratio equal to 1.2, and a quick ratio equal to 1.1, what is Bemis Net Working Capital?
4.) Lex Corp is considering three potential future investment projects as follows (note that cash flows occur at the end of each year):
 a.) If Lex Corp faces a discount rate of 5%, which of the above projects should it pursue?
b.) Which project has the highest internal rate of return?
5.) An Edward Jones client is considering different investments with an equivalent risk profile:
a. A five-year security which pays 0.5% interest monthly
b. A five-year security which pays 1.5% interest quarterly, or
c. A five-year security which pays 3% semi-annually
Calculate the annualized return for each to determine which has the highest yield.
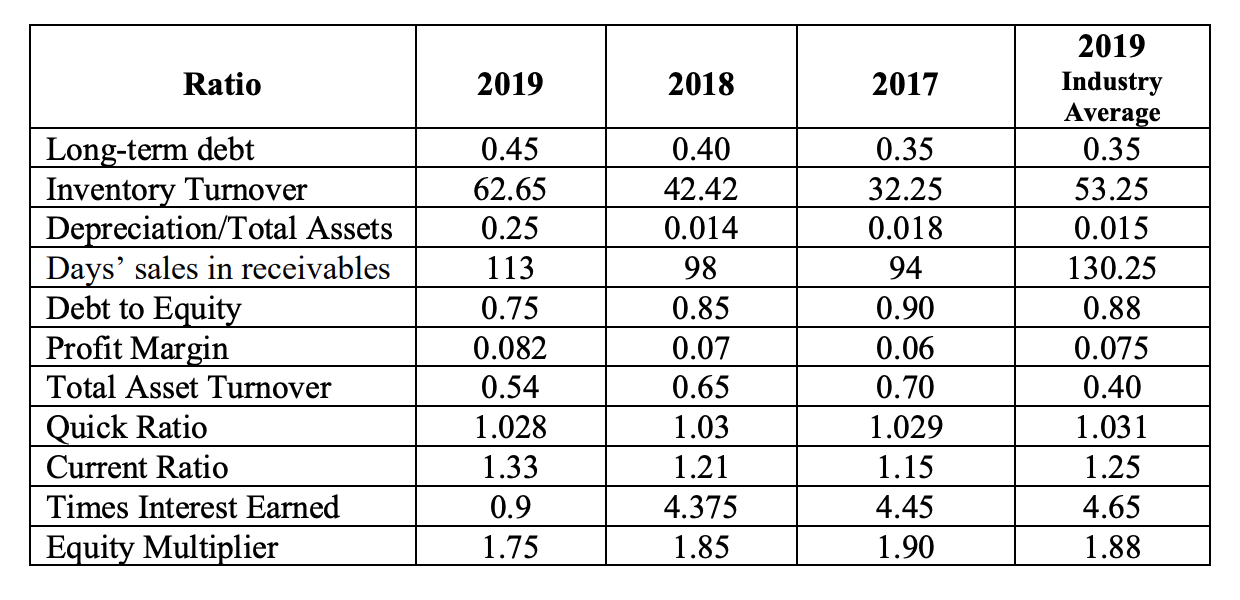
6You have been hired as a financial analyst for BlackRock and asked to conduct an independent assessment of Freshfoods Corp. (FFC). FFC is a firm specializing in the production and sale of fresh organic foods and products. You have compiled the following data for FFC and its industry:

a. In the annual shareholder report, FFCs senior management stated that 2017 was an excellent year for our company with respect to our ability to meet our short-term obligations. We had higher liquidity largely due to an increase in highly liquid current assets (cash, account receivables and short-term marketable securities). Is this correct? Explain and use relevant data from above in your analysis.
b. What can you say about the firm's asset efficiency? Provide as complete an answer as possible given the above information.
c. Provide a complete assessment of the firm's solvency and leverage based upon the above information.
| Project Investment (Year 0) North $9,.000 South $10,000 East $12,000 West $15,000 ($ millions) Year 1 Return $0 $1,000 $500 $2,500 Year 2 Return $1,500 $2,000 $2,000 $3,000 Year 3 Return $8,500 $8,000 $13,000 $12,000 Ratio 2019 2018 2017 Long-term debt | Inventory Turnover | Depreciation/Total Assets | Days' sales in receivables Debt to Equity Profit Margin | Total Asset Turnover Quick Ratio Current Ratio Times Interest Earned | Equity Multiplier 0.45 62.65 0.25 113 0.75 0.082 0.54 1.028 0.40 42.42 0.014 98 0.85 0.07 0.65 1.03 1.21 4.375 1.85 0.35 32.25 0.018 94 0.90 0.06 0.70 1.029 1.15 4.45 1.90 2019 Industry Average 0.35 53.25 0.015 130.25 0.88 0.075 0.40 1.031 1.25 4.65 1.88 1.33 0.9 1.75
Step by Step Solution
There are 3 Steps involved in it
Step: 1

Get Instant Access to Expert-Tailored Solutions
See step-by-step solutions with expert insights and AI powered tools for academic success
Step: 2

Step: 3

Ace Your Homework with AI
Get the answers you need in no time with our AI-driven, step-by-step assistance
Get Started


