Answered step by step
Verified Expert Solution
Link Copied!

Question

1 Approved Answer

3. An investigator draws a histogram for some height data, using the metric system. She is working in centimeters (cm). The vertical axis shows density,
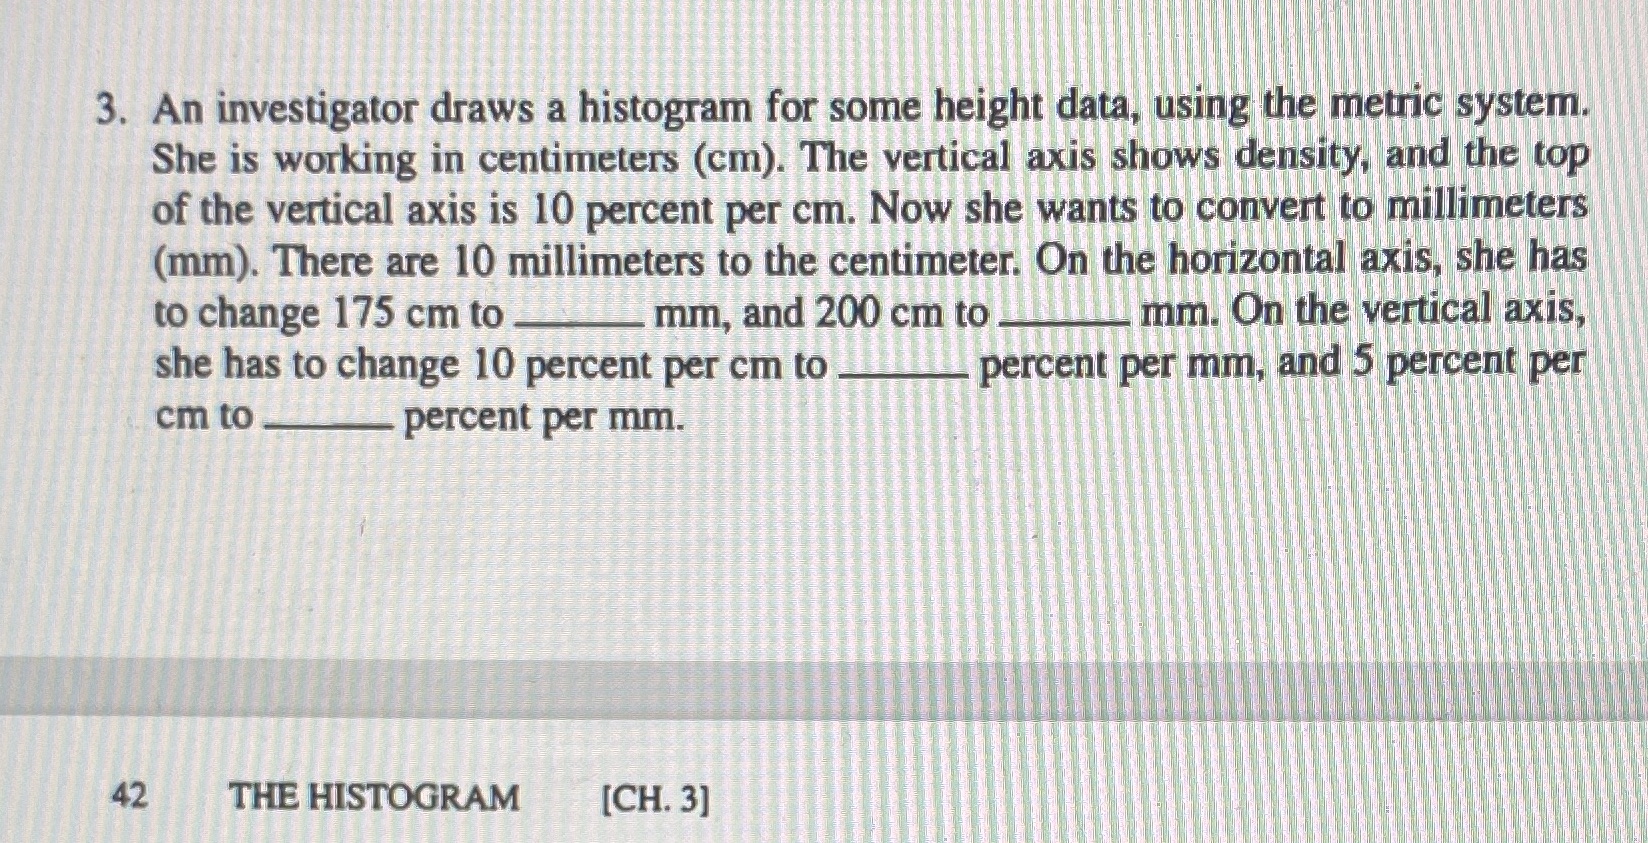
image text in transcribed
3. An investigator draws a histogram for some height data, using the metric system. She is working in centimeters (cm). The vertical axis shows density, and the top of the vertical axis is 10 percent per cm. Now she wants to convert to millimeters (mm). There are 10 millimeters to the centimeter. On the horizontal axis, she has to change 175 cm to mm, and 200 cm to mm. On the vertical axis, she has to change 10 percent per cm to percent per mm, and 5 percent per cm to percent per mm. 42 THE HISTOGRAM [CH. 3]

Step by Step Solution

There are 3 Steps involved in it

Step: 1

blur-text-image

Get Instant Access to Expert-Tailored Solutions

See step-by-step solutions with expert insights and AI powered tools for academic success

Step: 2

blur-text-image

Step: 3

blur-text-image

Ace Your Homework with AI

Get the answers you need in no time with our AI-driven, step-by-step assistance

Get Started

Recommended Textbook for

Precalculus, Enhanced

Authors: Cynthia Y Young

3rd Edition

1119339510, 9781119339519

More Books

Students also viewed these Mathematics questions