Answered step by step
Verified Expert Solution
Question
1 Approved Answer
3. An investment opportunity has projected costs and revenues as shown on the diagram in thousands of dollars. Year 1 2 3 4 5 6
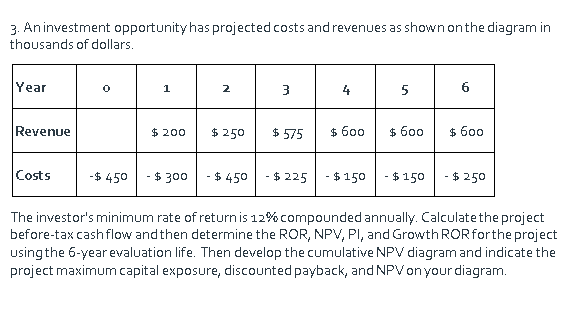
3. An investment opportunity has projected costs and revenues as shown on the diagram in thousands of dollars. Year 1 2 3 4 5 6 Revenue $ 200 $ 250 $ 575 $ 600 $ 600 $ 600 Costs - $ 450 - $300 - $ 450 - $ 225 - $ 150 - $ 150 $ 250 The investor's minimum rate of return is 12% compounded annually. Calculate the project before-tax cash flow and then determine the ROR, NPV, PI, and Growth RORforthe project using the 6-year evaluation life. Then develop the cumulative NPV diagram and indicate the project maximum capital exposure, discounted payback, and NPV on your diagram
Step by Step Solution
There are 3 Steps involved in it
Step: 1
Get Instant Access to Expert-Tailored Solutions
See step-by-step solutions with expert insights and AI powered tools for academic success
Step: 2
Step: 3
Ace Your Homework with AI
Get the answers you need in no time with our AI-driven, step-by-step assistance
Get Started