

Answered step by step
Verified Expert Solution
Question
1 Approved Answer
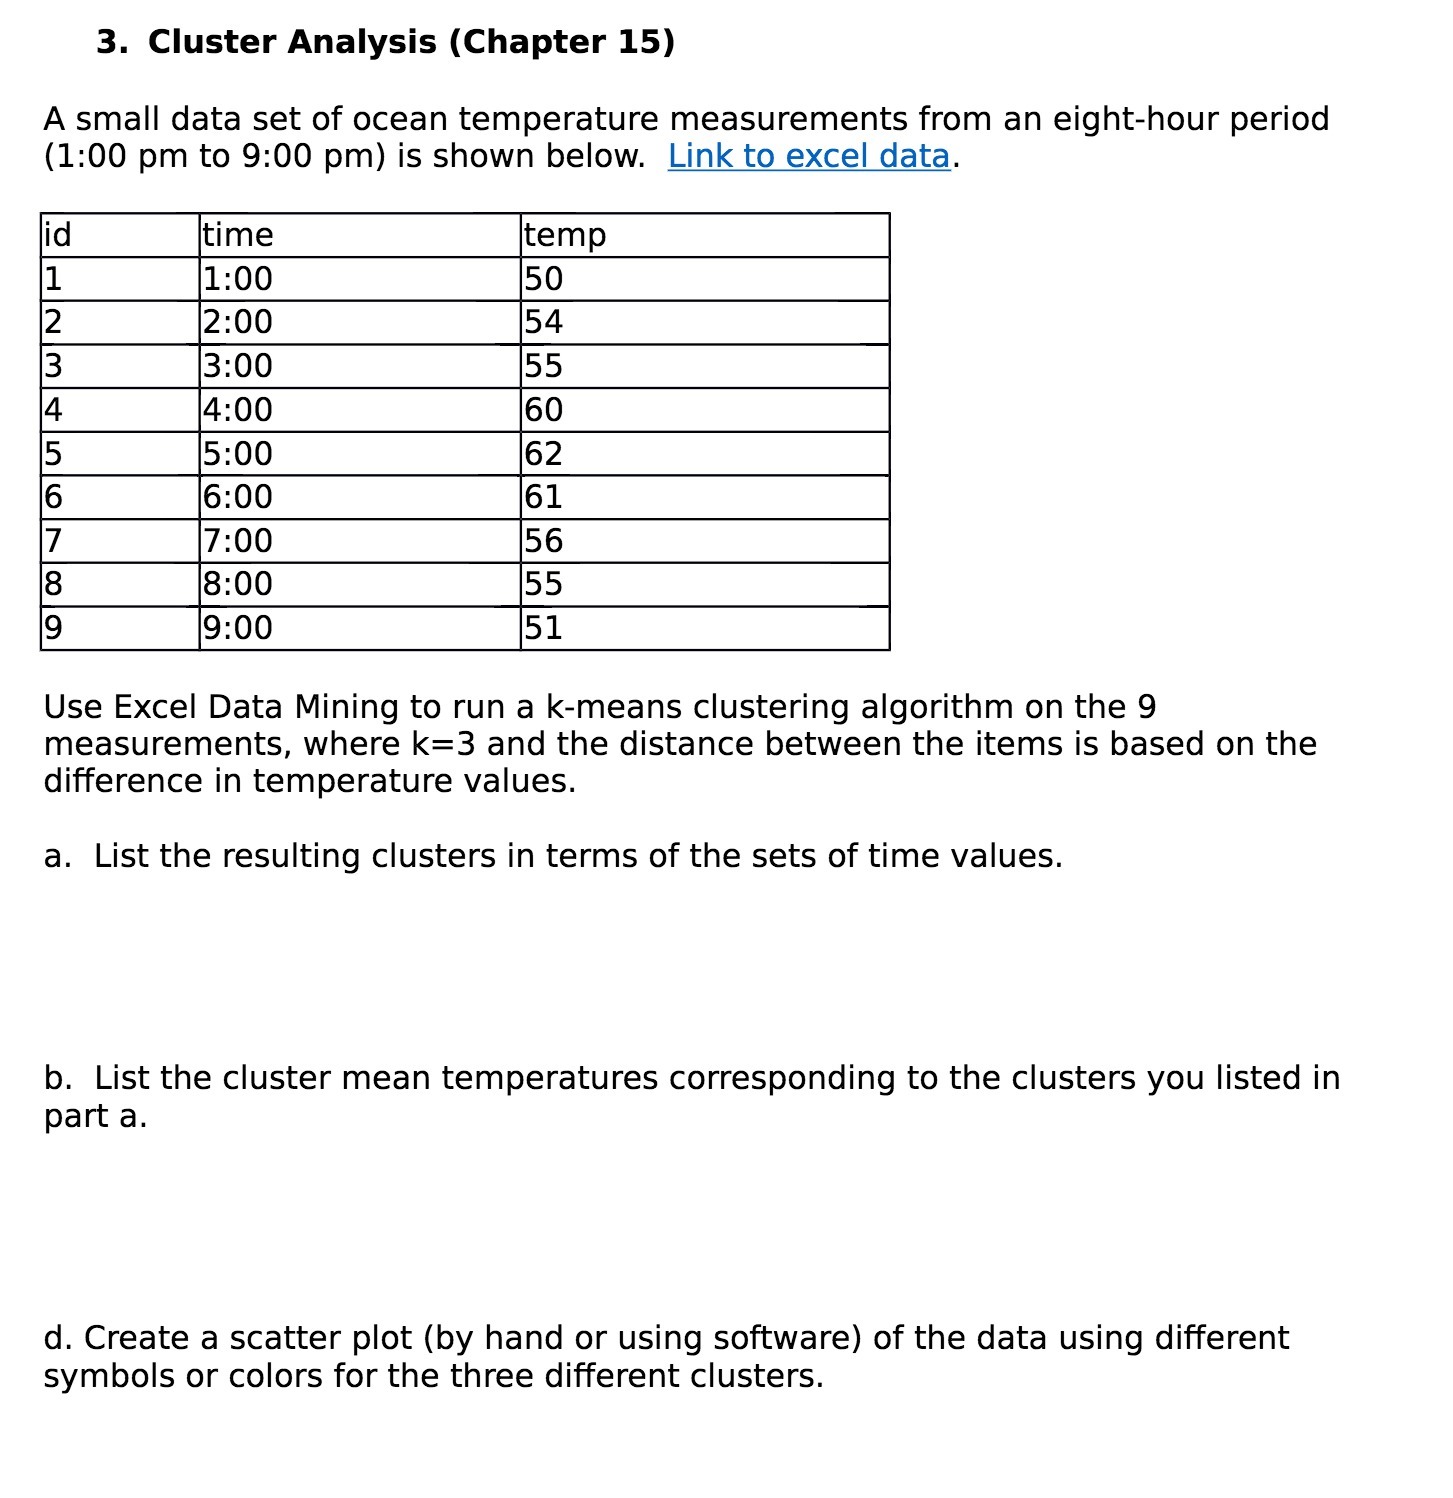
3. Cluster Analysis (Chapter 15) A small data set of ocean temperature measurements from an eight-hour period (1:00 pm to 9:00 pm) is shown below.
Step by Step Solution
There are 3 Steps involved in it
Step: 1

Get Instant Access to Expert-Tailored Solutions
See step-by-step solutions with expert insights and AI powered tools for academic success
Step: 2

Step: 3
Ace Your Homework with AI
Get the answers you need in no time with our AI-driven, step-by-step assistance
Get Started
Algebra Structure And Method Book 1
Authors: Brown Dolciani, Jeffery A. Cole Sorgenfrey
1st Edition
0395771161, 978-0395771167