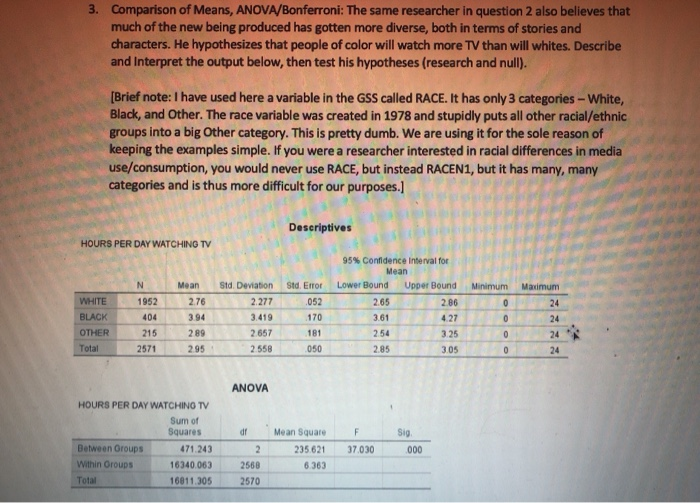
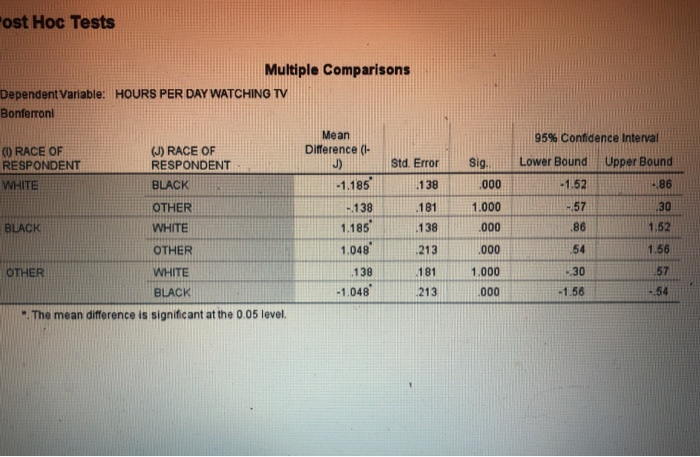
3. Comparison of Means, ANOVA/Bonferroni: The same researcher in question 2 also believes that much of the new being produced has gotten more diverse, both in terms of stories and characters. He hypothesizes that people of color will watch more TV than will whites. Describe and interpret the output below, then test his hypotheses (research and null). [Brief note: I have used here a variable in the GSS called RACE. It has only 3 categories - White, Black, and other. The race variable was created in 1978 and stupidly puts all other racial/ethnic groups into a big Other category. This is pretty dumb. We are using it for the sole reason of keeping the examples simple. If you were a researcher interested in racial differences in media use/consumption, you would never use RACE, but instead RACEN1, but it has many, many categories and is thus more difficult for our purposes.) Descriptives HOURS PER DAY WATCHING TV Minimum Maximum N 1952 404 215 2571 Mean 2.76 3.94 WHITE BLACK OTHER Total Std Deviation 2.277 3.419 2.657 2.558 Std. Error 052 170 181 050 95% Confidence interval for Mean Lower Bound Upper Bound 2.65 2.86 3.61 427 254 3.25 2.85 3.05 0 0 0 0 24 24 24 24 289 2.95 ANOVA dr F HOURS PER DAY WATCHING TV Sum of Squares Between Groups 471.243 Within Oroups 16340.063 Total 16811.305 Mean Square 235621 6.363 sig 000 2 2568 2570 37.030 "ost Hoc Tests 95% Confidence interval Lower Bound Upper Bound Sig .000 -1.52 4.86 Multiple Comparisons Dependent Variable: HOURS PER DAY WATCHING TV Bonferroni Mean (O) RACE OF (J) RACE OF Difference (L- RESPONDENT RESPONDENT Std. Error WHITE BLACK -1.185 .138 OTHER - 138 .181 BLACK WHITE 1.185 .138 OTHER 1,048 213 OTHER WHITE .138 .181 BLACK -1,048 213 The mean difference is significant at the 0.05 level. 1.000 -57 30 .000 .86 1.52 .000 54 1.56 -30 57 1.000 .000 -1.56 - 54 3. Comparison of Means, ANOVA/Bonferroni: The same researcher in question 2 also believes that much of the new being produced has gotten more diverse, both in terms of stories and characters. He hypothesizes that people of color will watch more TV than will whites. Describe and interpret the output below, then test his hypotheses (research and null). [Brief note: I have used here a variable in the GSS called RACE. It has only 3 categories - White, Black, and other. The race variable was created in 1978 and stupidly puts all other racial/ethnic groups into a big Other category. This is pretty dumb. We are using it for the sole reason of keeping the examples simple. If you were a researcher interested in racial differences in media use/consumption, you would never use RACE, but instead RACEN1, but it has many, many categories and is thus more difficult for our purposes.) Descriptives HOURS PER DAY WATCHING TV Minimum Maximum N 1952 404 215 2571 Mean 2.76 3.94 WHITE BLACK OTHER Total Std Deviation 2.277 3.419 2.657 2.558 Std. Error 052 170 181 050 95% Confidence interval for Mean Lower Bound Upper Bound 2.65 2.86 3.61 427 254 3.25 2.85 3.05 0 0 0 0 24 24 24 24 289 2.95 ANOVA dr F HOURS PER DAY WATCHING TV Sum of Squares Between Groups 471.243 Within Oroups 16340.063 Total 16811.305 Mean Square 235621 6.363 sig 000 2 2568 2570 37.030 "ost Hoc Tests 95% Confidence interval Lower Bound Upper Bound Sig .000 -1.52 4.86 Multiple Comparisons Dependent Variable: HOURS PER DAY WATCHING TV Bonferroni Mean (O) RACE OF (J) RACE OF Difference (L- RESPONDENT RESPONDENT Std. Error WHITE BLACK -1.185 .138 OTHER - 138 .181 BLACK WHITE 1.185 .138 OTHER 1,048 213 OTHER WHITE .138 .181 BLACK -1,048 213 The mean difference is significant at the 0.05 level. 1.000 -57 30 .000 .86 1.52 .000 54 1.56 -30 57 1.000 .000 -1.56 - 54