

Answered step by step
Verified Expert Solution
Question
1 Approved Answer
3. Complete the below table to calculate the balance sheet data in trend percents with 2016 as the base year. (Round your percentage answers to
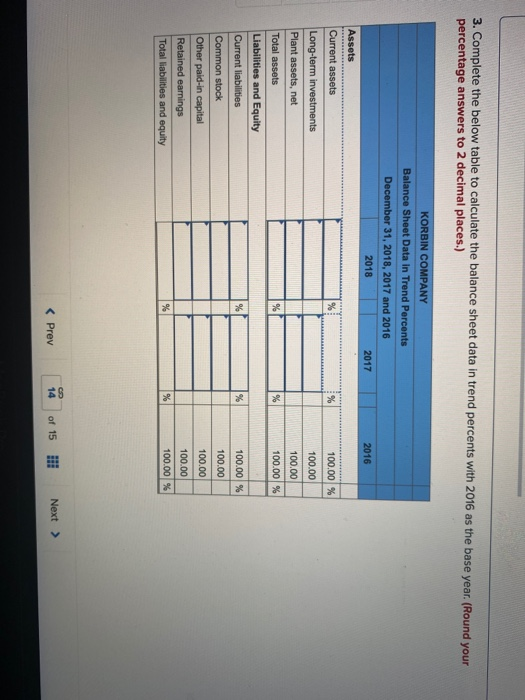
 3. Complete the below table to calculate the balance sheet data in trend percents with 2016 as the base year. (Round your percentage answers to 2 decimal places.) KORBIN COMPANY Balance Sheet Data In Trend Percents December 31, 2018, 2017 and 2016 2018 2017 2016 % % 100.00 % 100.00 100.00 % % 100.00 % Assets Current assets Long-term investments Plant assets, net Total assets Liabilities and Equity Current liabilities Common stock Other paid-in capital Retained earnings Total liabilities and equity % % 100.00 % 100.00 100.00 100.00 100.00 % % %
Step by Step Solution
There are 3 Steps involved in it
Step: 1

Get Instant Access to Expert-Tailored Solutions
See step-by-step solutions with expert insights and AI powered tools for academic success
Step: 2

Step: 3
Ace Your Homework with AI
Get the answers you need in no time with our AI-driven, step-by-step assistance
Get Started
Risk Based Management Led Audit Driven Safety Management Systems
Authors: Ron C. McKinnon
1st Edition
1498767923, 978-1498767927