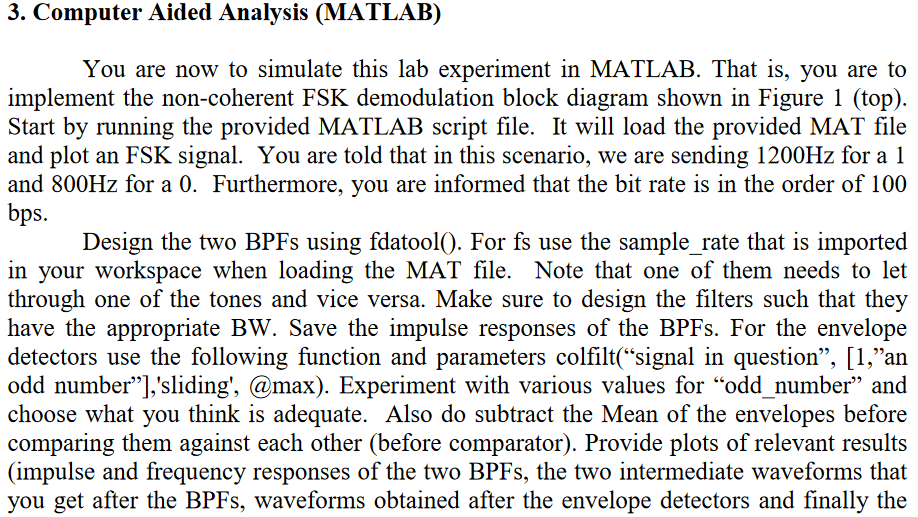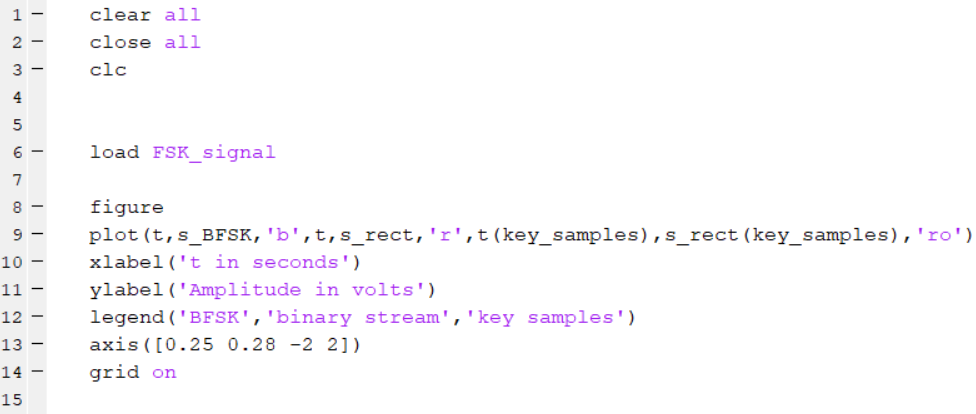


3. Computer Aided Analysis (MATLAB) You are now to simulate this lab experiment in MATLAB. That is, you are to implement the non-coherent FSK demodulation block diagram shown in Figure 1 (top) Start by running the provided MATLAB script file. It will load the provided MAT file and plot an FSK signal. You are told that in this scenario, we are sending 1200Hz for a 1 and 800Hz for a 0. Furthermore, you are informed that the bit rate is in the order of 100 Design the two BPFs using fdatool(). For fs use the sample rate that is imported in your workspace when loading the MAT file. Note that one of them needs to let through one of the tones and vice versa. Make sure to design the filters such that they have the appropriate BW. Save the impulse responses of the BPFs. For the envelope detectors use the following function and parameters colfilt("signal in question", [1,"an odd number"], 'sliding', @max). Experiment with various values for "odd number" and choose what you think is adequate. Also do subtract the Mean of the envelopes before comparing them against each other (before comparator). Provide plots of relevant results (impulse and frequency responses of the two BPFs, the two intermediate waveforms that you get after the BPFs, waveforms obtained after the envelope detectors and finally the 3. Computer Aided Analysis (MATLAB) You are now to simulate this lab experiment in MATLAB. That is, you are to implement the non-coherent FSK demodulation block diagram shown in Figure 1 (top) Start by running the provided MATLAB script file. It will load the provided MAT file and plot an FSK signal. You are told that in this scenario, we are sending 1200Hz for a 1 and 800Hz for a 0. Furthermore, you are informed that the bit rate is in the order of 100 Design the two BPFs using fdatool(). For fs use the sample rate that is imported in your workspace when loading the MAT file. Note that one of them needs to let through one of the tones and vice versa. Make sure to design the filters such that they have the appropriate BW. Save the impulse responses of the BPFs. For the envelope detectors use the following function and parameters colfilt("signal in question", [1,"an odd number"], 'sliding', @max). Experiment with various values for "odd number" and choose what you think is adequate. Also do subtract the Mean of the envelopes before comparing them against each other (before comparator). Provide plots of relevant results (impulse and frequency responses of the two BPFs, the two intermediate waveforms that you get after the BPFs, waveforms obtained after the envelope detectors and finally the


