Answered step by step
Verified Expert Solution
Question
1 Approved Answer
3. Consider the continuous process y(t) consisting of a linear trend over a record length T. 3) Use the Frequency-Domain Derivative Theorem (section 2.4.2) to
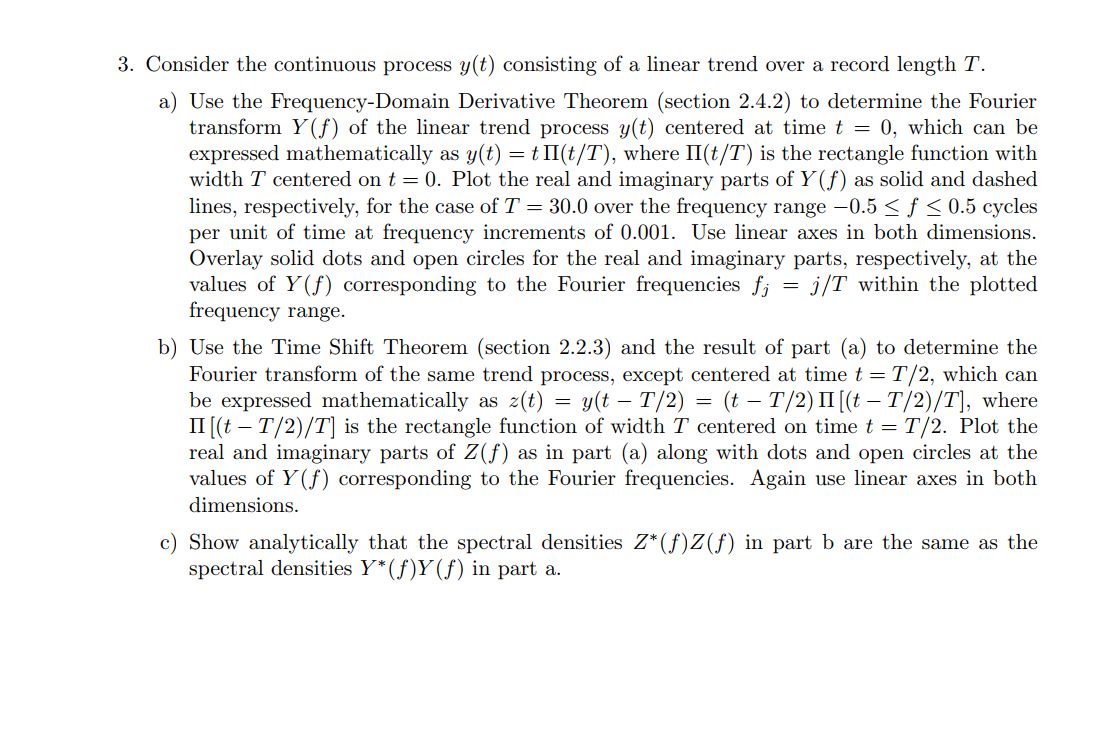
3. Consider the continuous process y(t) consisting of a linear trend over a record length T. 3) Use the Frequency-Domain Derivative Theorem (section 2.4.2) to determine the Fourier transform Y( f } of the linear trend process y(t) centered at time t = 0, which can be expressed mathematically as y(t) = tl'II[t,/T)= where H(t/T) is the rectangle function with width T centered on t = 0. Plot the real and imaginary parts of Y[f } as solid and dashed lines, respectively, for the case of T = 30.0 over the frequency range 0.5 S f S 0.5 cycles per unit of time at frequency increments of 0.001. Use linear axes in both dimensions. Overlay solid dots and open circles for the real and imaginary parts, respectively. at the values of Y0\") corresponding to the Fourier frequencies fi = j/T within the plotted frequency range. Use the Time Shift Theorem (section 2.2.3) and the result of part (a) to determine the Fourier transform of the same trend process, except centered at time t = T f 2, which can he expressed mathematically as 2(t) = y(t T/Q) = (t T/2)H[(t Tf2)/T], where H [(t T/2)/T] is the rectangle function of width T centered 011 time t = T/Q. Plot the real and imaginary parts of 2\") as in part (a) along with dots and open circles at the values of YU) corresponding to the Fourier frequencies. Again use linear axes in both dimensions. Show analytically that the spectral densities Z *( f)Z ( f ) in part b are the same as the spectral densities Y*(f)Y(f) in part a
Step by Step Solution
There are 3 Steps involved in it
Step: 1
Get Instant Access to Expert-Tailored Solutions
See step-by-step solutions with expert insights and AI powered tools for academic success
Step: 2
Step: 3
Ace Your Homework with AI
Get the answers you need in no time with our AI-driven, step-by-step assistance
Get Started