Answered step by step
Verified Expert Solution
Question
1 Approved Answer
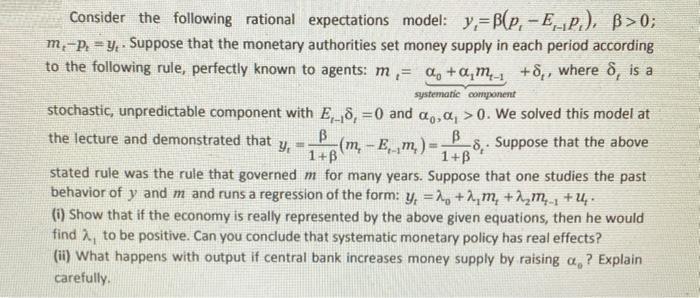
Consider the following rational expectations model: y, B(p, -EP), B>0; m-p=y. Suppose that the monetary authorities set money supply in each period according to

Consider the following rational expectations model: y, B(p, -EP), B>0; m-p=y. Suppose that the monetary authorities set money supply in each period according to the following rule, perfectly known to agents: m, a, +a,m +8,, where 8, is a systematic component stochastic, unpredictable component with E8, =0 and a,,a, >0. We solved this model at the lecture and demonstrated that B Y (m-Em) = -8, Suppose that the above 1+B 1+B stated rule was the rule that governed m for many years. Suppose that one studies the past behavior of y and m and runs a regression of the form: y, +m, +m_+U. (i) Show that if the economy is really represented by the above given equations, then he would find , to be positive. Can you conclude that systematic monetary policy has real effects? (ii) What happens with output if central bank increases money supply by raising a ? Explain carefully.
Step by Step Solution
★★★★★
3.46 Rating (156 Votes )
There are 3 Steps involved in it
Step: 1
Answer i If the economy is really represented by the above given equations then he would find 1 to be positive However this does not necessarily mean ...
Get Instant Access to Expert-Tailored Solutions
See step-by-step solutions with expert insights and AI powered tools for academic success
Step: 2

Step: 3

Ace Your Homework with AI
Get the answers you need in no time with our AI-driven, step-by-step assistance
Get Started


