

Answered step by step
Verified Expert Solution
Question
1 Approved Answer
3. Create a bar plot that shows the mean, median, and standard deviation of the Total Volume of the organic avocados sold in the


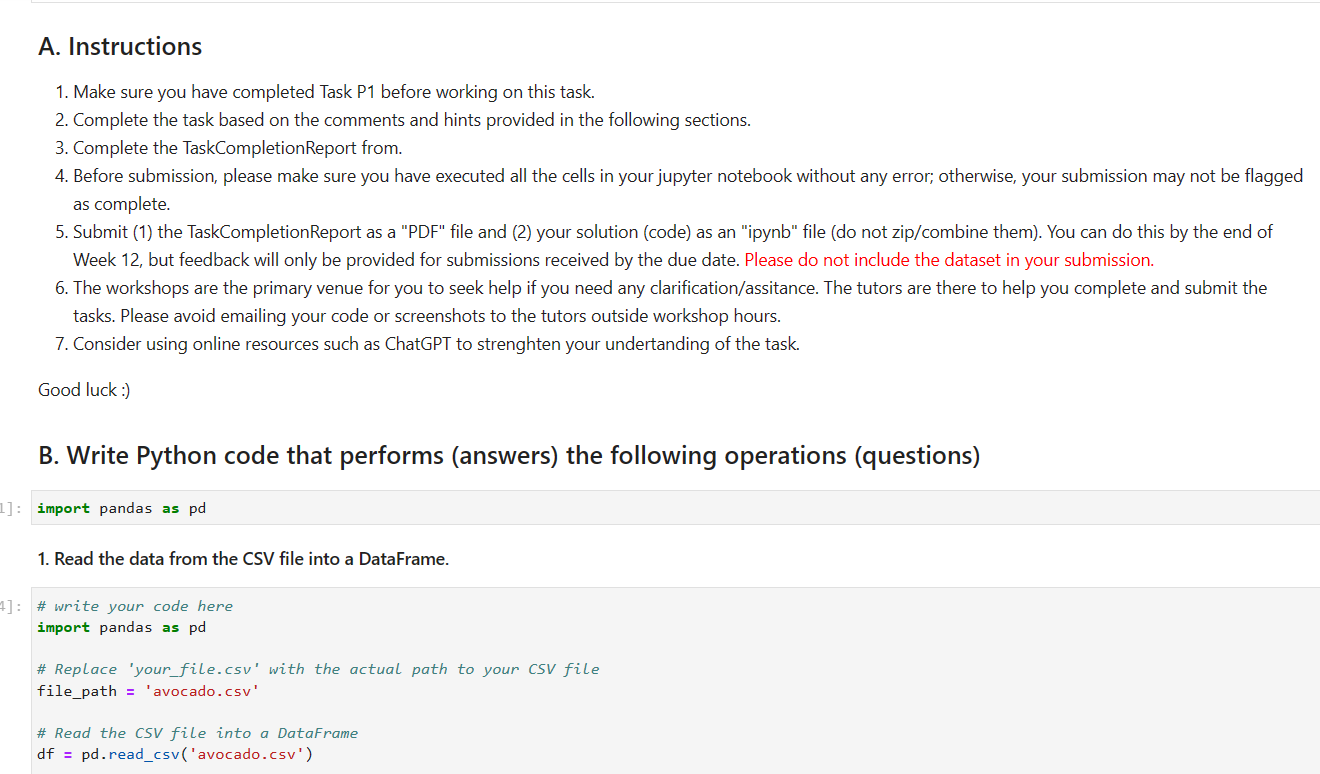
3. Create a bar plot that shows the mean, median, and standard deviation of the Total Volume of the organic avocados sold in the regions with the highest overall Total Volume from (including) 2017. 4. What is the mean and median of AveragePrice for each type of avocado (organic and conventional) in 2018? Be sure to include just the type, MeanPrice, and MedianPrice columns in the results. 5. Analyze the consistency of sales for Small Bags, Large Bags, XLarge Bags, and Total Bags of the top 3 avocado producing regions (excluding TotalUS) for each type of avocado over time. To explain consistency of sales, use the coefficient of variation, which is a statistical measure used to determine the consistency or variability of a data set. It is calculated as the ratio of the standard deviation to the mean, expressed as a percentage. Higher values of the coefficient of variation indicate greater variability or inconsistency in the data, while lower values indicate more consistency in the data. Analyzing the Avocado Data This task uses the avocado dataset. The dataset contains historical data on avocado prices and sales volume in multiple U.S. markets. One of the columns in this dataset, Unnamed: 0, contains sequential numbers that are irrelevant to analyzing this data. Three of the other columns contain sales for PLU (price look-up) codes 4046, 4225, and 4770. These columns will not be used in this task. If you review the data, you'll see that some of the regions overlap. For example, one of the regions is the entire U.S., and all of the other regions are parts of the U.S. Because of that, you would need to review this data carefully before determining the best way to analyze it. For the purposes of this task though, the overlapping regions won't be taken into consideration. https://www.kaggle.com/neuromusic/avocado-prices A. Instructions 1. Make sure you have completed Task P1 before working on this task. 2. Complete the task based on the comments and hints provided in the following sections. 3. Complete the TaskCompletionReport from. 4. Before submission, please make sure you have executed all the cells in your jupyter notebook without any error; otherwise, your submission may not be flagged as complete. 5. Submit (1) the TaskCompletion Report as a "PDF" file and (2) your solution (code) as an "ipynb" file (do not zip/combine them). You can do this by the end of Week 12, but feedback will only be provided for submissions received by the due date. Please do not include the dataset in your submission. 6. The workshops are the primary venue for you to seek help if you need any clarification/assitance. The tutors are there to help you complete and submit the tasks. Please avoid emailing your code or screenshots to the tutors outside workshop hours. 7. Consider using online resources such as ChatGPT to strenghten your undertanding of the task. Good luck :) B. Write Python code that performs (answers) the following operations (questions) 1]: import pandas as pd 1. Read the data from the CSV file into a DataFrame. 4]: # write your code here import pandas as pd # Replace 'your_file.csv' with the actual path to your CSV file file_path = 'avocado.csv' # Read the CSV file into a DataFrame df = pd.read_csv('avocado.csv')
Step by Step Solution
There are 3 Steps involved in it
Step: 1

Get Instant Access to Expert-Tailored Solutions
See step-by-step solutions with expert insights and AI powered tools for academic success
Step: 2

Step: 3
Ace Your Homework with AI
Get the answers you need in no time with our AI-driven, step-by-step assistance
Get Started
Probability and Random Processes With Applications to Signal Processing and Communications
Authors: Scott Miller, Donald Childers
2nd edition
123869811, 978-0121726515, 121726517, 978-0130200716, 978-0123869814