

Answered step by step
Verified Expert Solution
Question
1 Approved Answer
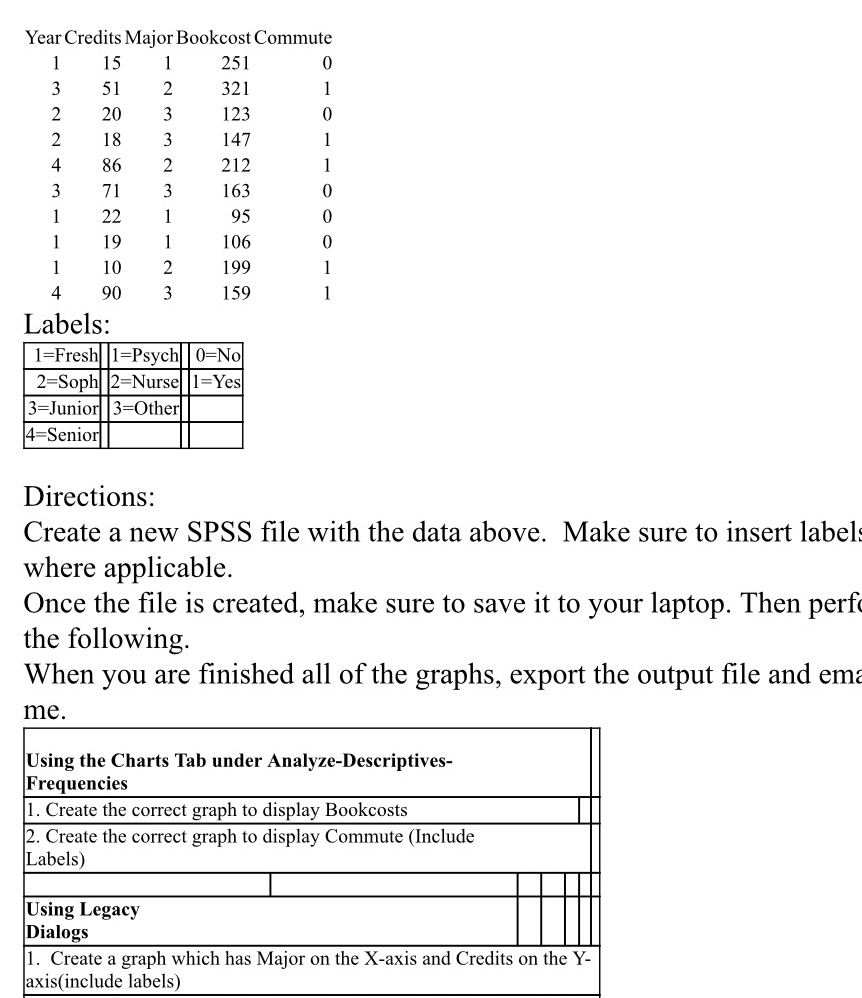
3. Create the correct graph for Year and Bookcost(include labels) 4. Create the correct graph for Year and Commute (include Labels) Year Credits Major Bookcost
3. Create the correct graph for Year and Bookcost(include labels) 4. Create the correct graph for Year and Commute (include Labels)
Step by Step Solution
There are 3 Steps involved in it
Step: 1

Get Instant Access to Expert-Tailored Solutions
See step-by-step solutions with expert insights and AI powered tools for academic success
Step: 2

Step: 3
Ace Your Homework with AI
Get the answers you need in no time with our AI-driven, step-by-step assistance
Get Started
Linear Algebra With Applications
Authors: Gareth Williams, Williams
9th Edition
1284120104, 9781284120103