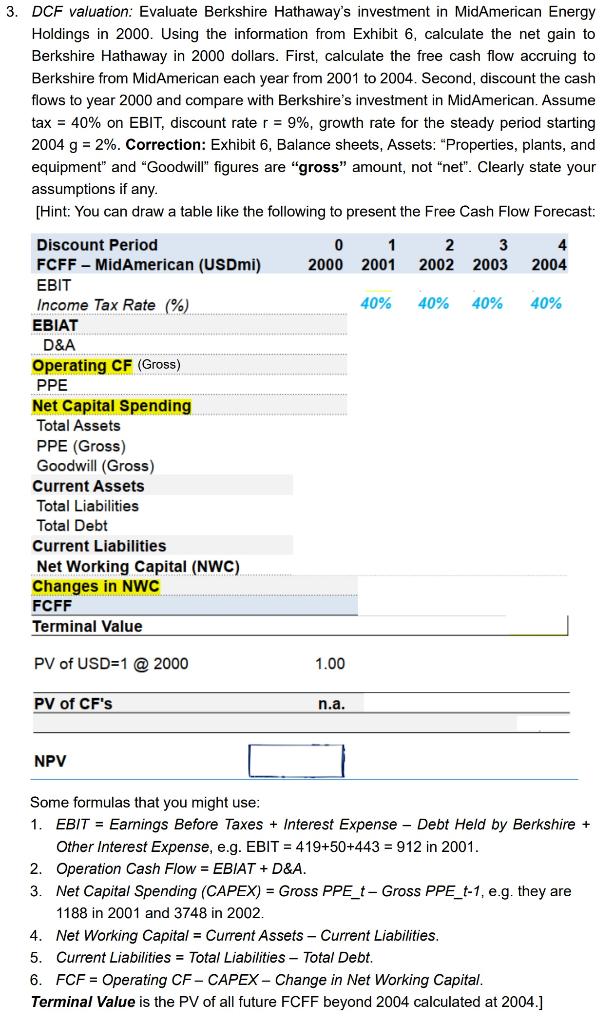
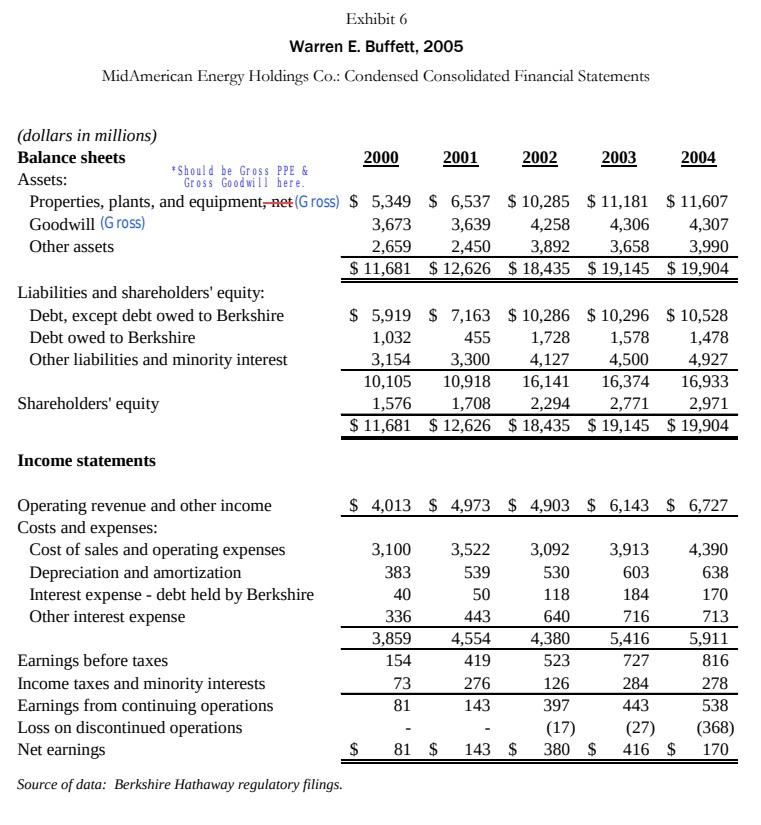
3. DCF valuation: Evaluate Berkshire Hathaway's investment in MidAmerican Energy Holdings in 2000. Using the information from Exhibit 6, calculate the net gain to Berkshire Hathaway in 2000 dollars. First, calculate the free cash flow accruing to Berkshire from MidAmerican each year from 2001 to 2004. Second, discount the cash flows to year 2000 and compare with Berkshire's investment in MidAmerican. Assume tax = 40% on EBIT, discount rate r = 9%, growth rate for the steady period starting 2004 g = 2%. Correction: Exhibit 6, Balance sheets, Assets: "Properties, plants, and equipment" and "Goodwill" figures are "gross" amount, not "net". Clearly state your assumptions if any. [Hint: You can draw a table like the following to present the Free Cash Flow Forecast: Discount Period 0 1 2 3 4 FCFF MidAmerican (USDmi) 2000 2001 2002 2003 2004 EBIT Income Tax Rate (%) 40% 40% 40% 40% EBIAT D&A Operating CF (Gross) PPE Net Capital Spending Total Assets PPE (Gross) Goodwill (Gross) Current Assets Total Liabilities Total Debt Current Liabilities Net Working Capital (NWC) Changes in NWC FCFF Terminal Value PV of USD=1 @2000 1.00 PV of CF's n.a. NPV Some formulas that you might use: 1. EBIT = Earnings Before Taxes + Interest Expense Debt Held by Berkshire + Other Interest Expense, e.g. EBIT = 419+50+443 = 912 in 2001. 2. Operation Cash Flow = EBIAT + D&A. 3. Net Capital Spending (CAPEX) = Gross PPE_t-Gross PPE_t-1, e.g. they are 1188 in 2001 and 3748 in 2002. 4. Net Working Capital = Current Assets Current Liabilities. 5. Current Liabilities = Total Liabilities - Total Debt. 6. FCF = Operating CF-CAPEX-Change in Net Working Capital. Terminal Value is the PV of all future FCFF beyond 2004 calculated at 2004.] Exhibit 6 Warren E. Buffett, 2005 MidAmerican Energy Holdings Co.: Condensed Consolidated Financial Statements (dollars in millions) Balance sheets 2000 2001 2002 2003 2004 Assets: *Should be Gross PPE & Gross Goodwill here. Properties, plants, and equipment, net (Gross) $5,349 $ 6,537 $10,285 $11,181 $11,607 Goodwill (Gross) 3,673 3,639 4,258 4,306 4,307 Other assets 2,659 2,450 3,892 3,990 3,658 $19,145 $ 19,904 $11,681 $12,626 $18,435 Liabilities and shareholders' equity: Debt, except debt owed to Berkshire Debt owed to Berkshire $5,919 $ 7,163 $10,286 $10,296 $ 10,528 1,728 1,578 1,478 4,127 4,500 4,927 1,032 455 Other liabilities and minority interest 3,154 10,105 3,300 10,918 16,141 16,374 2,294 16,933 Shareholders' equity 1,576 1,708 2,771 2,971 $11,681 $12,626 $18,435 $19,145 $19,904 Income statements Operating revenue and other income $ 4,013 $ 4,973 $4,903 $6,143 $ 6,727 Costs and expenses: Cost of sales and operating expenses 3,100 3,522 3,092 3,913 4,390 Depreciation and amortization 383 539 530 603 638 Interest expense - debt held by Berkshire 40 50 118 184 170 Other interest expense 336 443 640 716 713 3,859 4,554 4,380 5,416 5,911 Earnings before taxes 154 419 523 727 816 Income taxes and minority interests 73 276 126 284 278 Earnings from continuing operations 81 143 397 443 538 Loss on discontinued operations (17) (27) - (368) Net earnings $ 81 $ 143 $ 380 $ 416 $ 170 Source of data: Berkshire Hathaway regulatory filings. 3. DCF valuation: Evaluate Berkshire Hathaway's investment in MidAmerican Energy Holdings in 2000. Using the information from Exhibit 6, calculate the net gain to Berkshire Hathaway in 2000 dollars. First, calculate the free cash flow accruing to Berkshire from MidAmerican each year from 2001 to 2004. Second, discount the cash flows to year 2000 and compare with Berkshire's investment in MidAmerican. Assume tax = 40% on EBIT, discount rate r = 9%, growth rate for the steady period starting 2004 g = 2%. Correction: Exhibit 6, Balance sheets, Assets: "Properties, plants, and equipment" and "Goodwill" figures are "gross" amount, not "net". Clearly state your assumptions if any. [Hint: You can draw a table like the following to present the Free Cash Flow Forecast: Discount Period 0 1 2 3 4 FCFF MidAmerican (USDmi) 2000 2001 2002 2003 2004 EBIT Income Tax Rate (%) 40% 40% 40% 40% EBIAT D&A Operating CF (Gross) PPE Net Capital Spending Total Assets PPE (Gross) Goodwill (Gross) Current Assets Total Liabilities Total Debt Current Liabilities Net Working Capital (NWC) Changes in NWC FCFF Terminal Value PV of USD=1 @2000 1.00 PV of CF's n.a. NPV Some formulas that you might use: 1. EBIT = Earnings Before Taxes + Interest Expense Debt Held by Berkshire + Other Interest Expense, e.g. EBIT = 419+50+443 = 912 in 2001. 2. Operation Cash Flow = EBIAT + D&A. 3. Net Capital Spending (CAPEX) = Gross PPE_t-Gross PPE_t-1, e.g. they are 1188 in 2001 and 3748 in 2002. 4. Net Working Capital = Current Assets Current Liabilities. 5. Current Liabilities = Total Liabilities - Total Debt. 6. FCF = Operating CF-CAPEX-Change in Net Working Capital. Terminal Value is the PV of all future FCFF beyond 2004 calculated at 2004.] Exhibit 6 Warren E. Buffett, 2005 MidAmerican Energy Holdings Co.: Condensed Consolidated Financial Statements (dollars in millions) Balance sheets 2000 2001 2002 2003 2004 Assets: *Should be Gross PPE & Gross Goodwill here. Properties, plants, and equipment, net (Gross) $5,349 $ 6,537 $10,285 $11,181 $11,607 Goodwill (Gross) 3,673 3,639 4,258 4,306 4,307 Other assets 2,659 2,450 3,892 3,990 3,658 $19,145 $ 19,904 $11,681 $12,626 $18,435 Liabilities and shareholders' equity: Debt, except debt owed to Berkshire Debt owed to Berkshire $5,919 $ 7,163 $10,286 $10,296 $ 10,528 1,728 1,578 1,478 4,127 4,500 4,927 1,032 455 Other liabilities and minority interest 3,154 10,105 3,300 10,918 16,141 16,374 2,294 16,933 Shareholders' equity 1,576 1,708 2,771 2,971 $11,681 $12,626 $18,435 $19,145 $19,904 Income statements Operating revenue and other income $ 4,013 $ 4,973 $4,903 $6,143 $ 6,727 Costs and expenses: Cost of sales and operating expenses 3,100 3,522 3,092 3,913 4,390 Depreciation and amortization 383 539 530 603 638 Interest expense - debt held by Berkshire 40 50 118 184 170 Other interest expense 336 443 640 716 713 3,859 4,554 4,380 5,416 5,911 Earnings before taxes 154 419 523 727 816 Income taxes and minority interests 73 276 126 284 278 Earnings from continuing operations 81 143 397 443 538 Loss on discontinued operations (17) (27) - (368) Net earnings $ 81 $ 143 $ 380 $ 416 $ 170 Source of data: Berkshire Hathaway regulatory filings