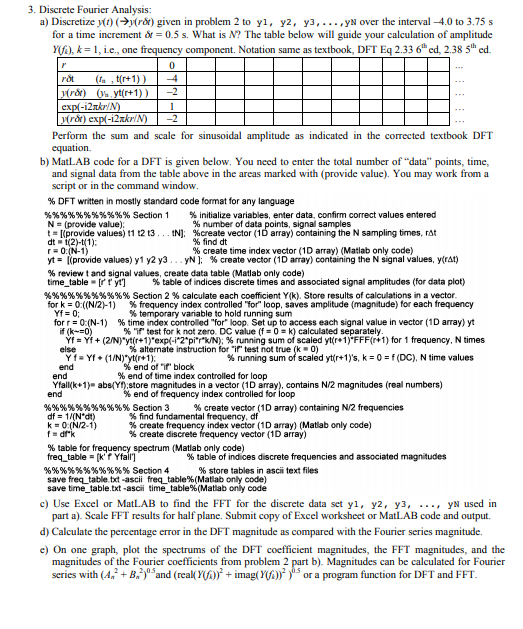
3. Discrete Fourier Analysis: a) Discretize y(t) (y(r&) given in problem 2 to y1, y2, y3, . yN over the interval-4.0 to 3.75 s for a time increment & = 0.5 s. What is N? The table below will guide your calculation of amplitude YU ), k = 1, Le.. one frequencv component. Notation same as textbook, DFT Eq 2.33 6th ed. 2.38 5th ed. -2 Perform the sum and scale for sinusoidal amplitude as indicated in the corrected textbook DFT equation. b) MatLAB code for a DFT is given below. You need to enter the total number of "data" points, time, and signal data from the table above in the areas marked with (provide value). You may work from a script or in the command window % DFT written in mostly standard code format for any language %%%%%%%%%%% Section 1 % initialize variables, enter data, confirm correct values entered N = (provide value) t = [(provide values) t1 t2 t3 . . tNI: %create vector (1D array) containing the N sampling tirmes, rat dt (2)-t1) r 0(N-1) yt = [(provide values) y 1 y2 y3 yN ]; % create vector (1D array) containing the N signal values, y(ran % number of data signal samples %find dt % create time index vector (1D array)(Matlab only code) % review t and signal values, create data table (Matlab only code) time table [r t y] % table of indices discrete times and associated signal amplitudes (for data plot) %%%%%%%%%%% Section 2 % calculate each coefficient Y(k). Store results of calculations in a vector for k = O ((N/2)-1) % frequency index controlled "Yor" loop, saves amplitude (magnitude) for each frequency % temporary variable to hold running sum for r:0 (N-1) %time index controled "for"loop Set up to access each signal value in wector (1D array) yt ifYf 0) + (2N)%(+1 est fo kro zerNDC van engsum of a le lated separately.) for 1 frequency, N % "if" test for k not zero DC value (f = 0 k) calculated separately Yf = Yf + (2/N).yt(r+1).exp(-72.pi"r.k/N); % running sum of scaled yt(r+1).FFF(r+1) for 1 frequency. N times % alternate instruction for "if" test not true (k-0) % running sum of scaled yt(r+1)'s, k = 0 zf (DC), N time values end of if block end end % end of time index controlled for loop Yfall(k+1). abs(YD:store magnitudes in a vector(1D array), contains N/2 magnitudes (real numbers) % end of frequency index controlled for % create vector (1D array) containing N/2 frequencies %%%%%%%%%%% Section 3 df = 1/(N.dt k = 0 (N/2.1) f=df"k % find fundamental frequency, df % create % create discrete index vector (1D array) (Matiab only code) vector 1D array) % table for frequency spectrum (Matlab only code) freq table [kf Yfall] % table of indices discrete frequencies and associated magnitudes % store tables in ascii text files save frea_table txt-ascii freq-table%(Matlab only code) save time tablett-ascii time table%(Matlab only code c) Use Excel or MatLAB to find the FFT for the discrete data set yl, y2, y3, ..., yN used in part a). Scale FFT results for half plane. Submit copy of Excel worksheet or MatLAB code and output d) Calculate the percentage error in the DFT magnitude as compared with the Fourier series magnitude e) On one graph, plot the spectrums of the DFT coefficient magnitudes, the FFT magnitudes, and the magnitudes of the Fourier coefficients from problem 2 part b). Magnitudes can be calculated for Fourier series with (A+B,) Sand (real Y)+imag(Yf)ora program function for DFT and FFT 3. Discrete Fourier Analysis: a) Discretize y(t) (y(r&) given in problem 2 to y1, y2, y3, . yN over the interval-4.0 to 3.75 s for a time increment & = 0.5 s. What is N? The table below will guide your calculation of amplitude YU ), k = 1, Le.. one frequencv component. Notation same as textbook, DFT Eq 2.33 6th ed. 2.38 5th ed. -2 Perform the sum and scale for sinusoidal amplitude as indicated in the corrected textbook DFT equation. b) MatLAB code for a DFT is given below. You need to enter the total number of "data" points, time, and signal data from the table above in the areas marked with (provide value). You may work from a script or in the command window % DFT written in mostly standard code format for any language %%%%%%%%%%% Section 1 % initialize variables, enter data, confirm correct values entered N = (provide value) t = [(provide values) t1 t2 t3 . . tNI: %create vector (1D array) containing the N sampling tirmes, rat dt (2)-t1) r 0(N-1) yt = [(provide values) y 1 y2 y3 yN ]; % create vector (1D array) containing the N signal values, y(ran % number of data signal samples %find dt % create time index vector (1D array)(Matlab only code) % review t and signal values, create data table (Matlab only code) time table [r t y] % table of indices discrete times and associated signal amplitudes (for data plot) %%%%%%%%%%% Section 2 % calculate each coefficient Y(k). Store results of calculations in a vector for k = O ((N/2)-1) % frequency index controlled "Yor" loop, saves amplitude (magnitude) for each frequency % temporary variable to hold running sum for r:0 (N-1) %time index controled "for"loop Set up to access each signal value in wector (1D array) yt ifYf 0) + (2N)%(+1 est fo kro zerNDC van engsum of a le lated separately.) for 1 frequency, N % "if" test for k not zero DC value (f = 0 k) calculated separately Yf = Yf + (2/N).yt(r+1).exp(-72.pi"r.k/N); % running sum of scaled yt(r+1).FFF(r+1) for 1 frequency. N times % alternate instruction for "if" test not true (k-0) % running sum of scaled yt(r+1)'s, k = 0 zf (DC), N time values end of if block end end % end of time index controlled for loop Yfall(k+1). abs(YD:store magnitudes in a vector(1D array), contains N/2 magnitudes (real numbers) % end of frequency index controlled for % create vector (1D array) containing N/2 frequencies %%%%%%%%%%% Section 3 df = 1/(N.dt k = 0 (N/2.1) f=df"k % find fundamental frequency, df % create % create discrete index vector (1D array) (Matiab only code) vector 1D array) % table for frequency spectrum (Matlab only code) freq table [kf Yfall] % table of indices discrete frequencies and associated magnitudes % store tables in ascii text files save frea_table txt-ascii freq-table%(Matlab only code) save time tablett-ascii time table%(Matlab only code c) Use Excel or MatLAB to find the FFT for the discrete data set yl, y2, y3, ..., yN used in part a). Scale FFT results for half plane. Submit copy of Excel worksheet or MatLAB code and output d) Calculate the percentage error in the DFT magnitude as compared with the Fourier series magnitude e) On one graph, plot the spectrums of the DFT coefficient magnitudes, the FFT magnitudes, and the magnitudes of the Fourier coefficients from problem 2 part b). Magnitudes can be calculated for Fourier series with (A+B,) Sand (real Y)+imag(Yf)ora program function for DFT and FFT