Question
3) Do people drive more slowly on tree-lined street? In the following table x is a random variable representing the number of tree per

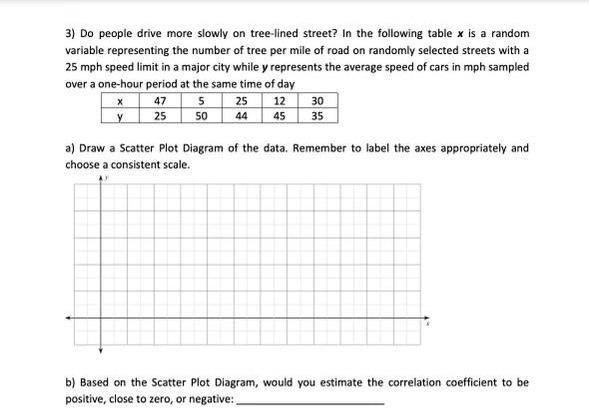
3) Do people drive more slowly on tree-lined street? In the following table x is a random variable representing the number of tree per mile of road on randomly selected streets with a 25 mph speed limit in a major city while y represents the average speed of cars in mph sampled over a one-hour period at the same time of day X 47 5 25 12 30 y 25 50 44 45 35 a) Draw a Scatter Plot Diagram of the data. Remember to label the axes appropriately and choose a consistent scale. b) Based on the Scatter Plot Diagram, would you estimate the correlation coefficient to be positive, close to zero, or negative:
Step by Step Solution
There are 3 Steps involved in it
Step: 1

Get Instant Access to Expert-Tailored Solutions
See step-by-step solutions with expert insights and AI powered tools for academic success
Step: 2

Step: 3

Ace Your Homework with AI
Get the answers you need in no time with our AI-driven, step-by-step assistance
Get StartedRecommended Textbook for
Understanding Business Statistics
Authors: Stacey Jones, Tim Bergquist, Ned Freed
1st edition
1118145259, 978-1118145258
Students also viewed these Mathematics questions
Question
Answered: 1 week ago
Question
Answered: 1 week ago
Question
Answered: 1 week ago
Question
Answered: 1 week ago
Question
Answered: 1 week ago
Question
Answered: 1 week ago
Question
Answered: 1 week ago
Question
Answered: 1 week ago
Question
Answered: 1 week ago
Question
Answered: 1 week ago
Question
Answered: 1 week ago
Question
Answered: 1 week ago
Question
Answered: 1 week ago
Question
Answered: 1 week ago
Question
Answered: 1 week ago
Question
Answered: 1 week ago
Question
Answered: 1 week ago
Question
Answered: 1 week ago
Question
Answered: 1 week ago
Question
Answered: 1 week ago
Question
Answered: 1 week ago
View Answer in SolutionInn App


