

Question
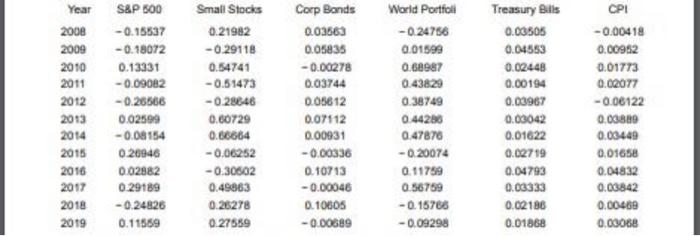
3. Download the data from the following data table ( you can watch the following video on how you can convert the below table to
3. Download the data from the following data table ( you can watch the following video on how you can convert the below table to excel file . How To Download the Table ' )
a . Compute the average return for each of the assets from 2008 to 2019 .
b . Compute the variance and standard deviation for each of the assets from 2008 to 2019 .
c . Which asset was riskiest during the time between 2008-2019 ? How does that fit with your intuition ? .
Compute the average return for each of the assets from 2008 to 2019 .
a . Compute the average return for each of the assets from 2008 to 2019 .
The average return for the S & P 500 was The average return for the Small Stocks was The average return for the Carp Bands was The average return for the World Portfolio was The average return for the Treasury Bils was The average for the CPI was ( Round to five decimal places . )
b . Compute the variance and standard deviation for each of the assets from 2008 to 2019 .
The variance for the S & P 500 was ( Round to five decimal places . )
The variance for the Small Stocks was ( Round to five decimal places . ) ( Round to five decimal places . )
the World Portfolio was ( Round to five decimal places . )
The variance for the Treasury Bils was ( Round to five decimal places . )
The variance for the CPI was The standard deviation for the S & P 500 was
The standard deviation for the Small Stocks was The standard deviation for the Corp Bonds was
The standard deviation for the World Portfolio was The standard deviation for the Treasury Bills was
Also stander devantion for CPI was.....
Step by Step Solution
There are 3 Steps involved in it
Step: 1

Get Instant Access to Expert-Tailored Solutions
See step-by-step solutions with expert insights and AI powered tools for academic success
Step: 2

Step: 3
Ace Your Homework with AI
Get the answers you need in no time with our AI-driven, step-by-step assistance
Get Started
The New CFO Financial Leadership Manual
Authors: Steven M. Bragg
3rd Edition
0470882565, 978-0470882566