3. Duralex Inc., a medium-sized plastic molding company, had enjoyed a significant run up in revenues and profits under the leadership of Marcus Lenovo. Despite the fierce competition, Duralexs stock had tripled in value over the past five years making the shareholders very happy. Recently, however, the stock price had dipped sharply raising concerns among security analysts.
The analysts had given the firms closest rival, Apex Molding, a Strong Buy rating while downgrading Duralexs rating to a Hold. Shareholders were outraged and demanded explanations. You are asked to perform a DuPont analysis and prepare report.
Show all work
Required:
- How can DuPont analysis be performed? Explain.
- Based on information in the companies financial statements (APPENDIX A) calculate ROE of both Duralex and Apex, using DuPont method.
- Identify and explain the causes of differences in the two companies ROE.
- Explain, in some detail, the differences in the companies operating, asset management, and financing strategies.
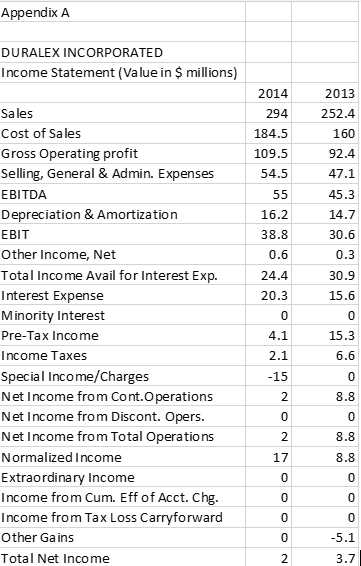
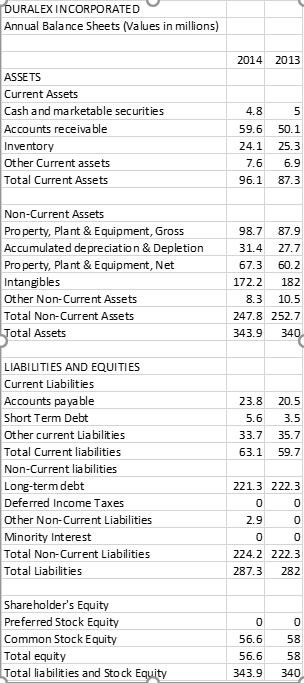
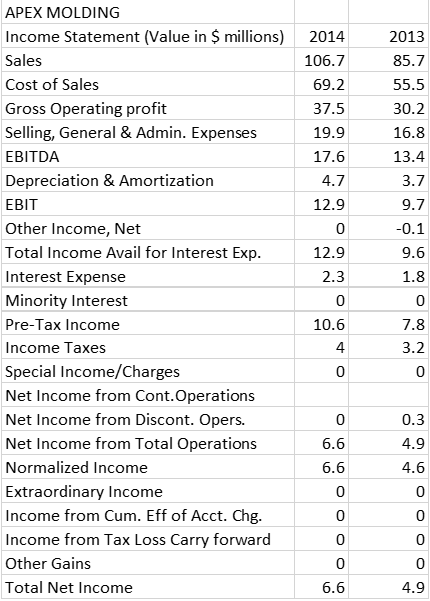
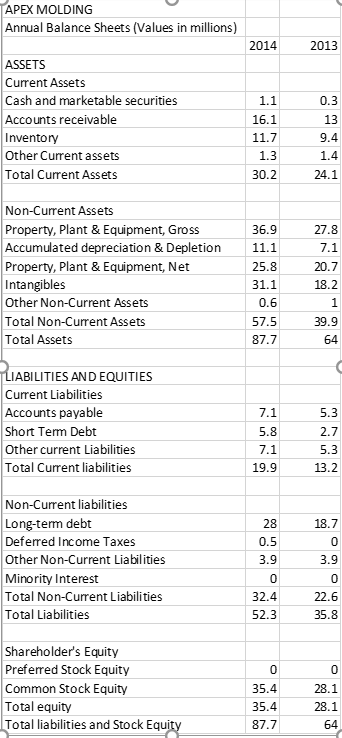
Appendix A DURALEX INCORPORATED Income Statement (Value in $ millions) 2014 294 184.5 109.5 54.5 55 16.2 38.8 0.6 24.4 20.3 Sales Cost of Sales Gross Operating profit Selling, General & Admin. Expenses EBITDA Depreciation & Amortization EBIT Other Income, Net Total Income Avail for Interest Exp. Interest Expense Minority Interest Pre-Tax Income Income Taxes Special Income/Charges Net Income from Cont. Operations Net Income from Discont. Opers. Net Income from Total Operations Normalized Income Extraordinary Income Income from Cum. Eff of Acct. Chg. Income from Tax Loss Carryforward Other Gains Total Net Income 2013 252.4 160 92.4 47.1 45.3 14.7 30.6 0.3 30.9 15.6 0 15.3 6.6 4.1 2.1 0 8.8 -5.1 3.7 DURALEX INCORPORATED Annual Balance Sheets (Values in millions) 2014 2013 ASSETS Current Assets Cash and marketable securities Accounts receivable Inventory Other Current assets Total Current Assets 4.8 59.6 24.1 7.6 96.1 5 50.1 25.3 6.9 87.3 Non-Current Assets Property, Plant & Equipment, Gross Accumulated depreciation & Depletion Property, Plant & Equipment, Net Intangibles Other Non-Current Assets Total Non-Current Assets Total Assets 98.7 87.9 31.4 27.7 67.3 60.2 172.2 182 8.3 10.5 247.8 252.7 343.9 340 23.8 5.6 33.7 63.1 20.5 3.5 35.7 59.7 LIABILITIES AND EQUITIES Current Liabilities Accounts payable Short Term Debt Other current Liabilities Total Current liabilities Non-Current liabilities Long-term debt Deferred Income Taxes Other Non-Current Liabilities Minority Interest Total Non-Current Liabilities Total Liabilities 221.3 222.3 0 0 2. 90 0 0 224.2 222.3 287.3 282 Shareholder's Equity Preferred Stock Equity Common Stock Equity Total equity Total liabilities and Stock Equity 0 56.6 56.6 343.9 0 58 58 340 2014 106.7 69.2 37.5 19.9 17.6 4.7 12.9 2013 85.7 55.5 30.2 16.8 13.4 3.7 9.7 -0.1 9.6 12.9 2.3 APEX MOLDING Income Statement (Value in $ millions) Sales Cost of Sales Gross Operating profit Selling, General & Admin. Expenses EBITDA Depreciation & Amortization EBIT Other Income, Net Total Income Avail for Interest Exp. Interest Expense Minority Interest Pre-Tax Income Income Taxes Special Income/Charges Net Income from Cont. Operations Net Income from Discont. Opers. Net Income from Total Operations Normalized Income Extraordinary Income Income from Cum. Eff of Acct. Chg. Income from Tax Loss Carry forward Other Gains Total Net Income 10.6 0 6.6 6.6 0 0.3 4.9 4.6 0 0 0 0 0 6.6 4.9 APEX MOLDING Annual Balance Sheets (Values in millions) 2014 2013 0.3 ASSETS Current Assets Cash and marketable securities Accounts receivable Inventory Other Current assets Total Current Assets 1.1 16.1 11.7 1.3 30.2 13 9.4 1.4 24.1 27.8 7.1 Non-Current Assets Property, Plant & Equipment, Gross Accumulated depreciation & Depletion Property, Plant & Equipment, Net Intangibles Other Non-Current Assets Total Non-Current Assets Total Assets 36.9 11.1 25.8 31.1 0.6 57.5 87.7 20.7 18.2 39.9 64 5.3 LIABILITIES AND EQUITIES Current Liabilities Accounts payable Short Term Debt Other current Liabilities Total Current liabilities 7.1 5.8 2.7 7.1 19.9 13.2 18.7 Non-Current liabilities Long-term debt Deferred Income Taxes Other Non-Current Liabilities Minority Interest Total Non-Current Liabilities Total Liabilities 3.9 3.9 32.4 22.6 35.8 0 Shareholder's Equity Preferred Stock Equity Common Stock Equity Total equity Total liabilities and Stock Equity 35.4 35.4 87.7 28.1 28.1 64 Appendix A DURALEX INCORPORATED Income Statement (Value in $ millions) 2014 294 184.5 109.5 54.5 55 16.2 38.8 0.6 24.4 20.3 Sales Cost of Sales Gross Operating profit Selling, General & Admin. Expenses EBITDA Depreciation & Amortization EBIT Other Income, Net Total Income Avail for Interest Exp. Interest Expense Minority Interest Pre-Tax Income Income Taxes Special Income/Charges Net Income from Cont. Operations Net Income from Discont. Opers. Net Income from Total Operations Normalized Income Extraordinary Income Income from Cum. Eff of Acct. Chg. Income from Tax Loss Carryforward Other Gains Total Net Income 2013 252.4 160 92.4 47.1 45.3 14.7 30.6 0.3 30.9 15.6 0 15.3 6.6 4.1 2.1 0 8.8 -5.1 3.7 DURALEX INCORPORATED Annual Balance Sheets (Values in millions) 2014 2013 ASSETS Current Assets Cash and marketable securities Accounts receivable Inventory Other Current assets Total Current Assets 4.8 59.6 24.1 7.6 96.1 5 50.1 25.3 6.9 87.3 Non-Current Assets Property, Plant & Equipment, Gross Accumulated depreciation & Depletion Property, Plant & Equipment, Net Intangibles Other Non-Current Assets Total Non-Current Assets Total Assets 98.7 87.9 31.4 27.7 67.3 60.2 172.2 182 8.3 10.5 247.8 252.7 343.9 340 23.8 5.6 33.7 63.1 20.5 3.5 35.7 59.7 LIABILITIES AND EQUITIES Current Liabilities Accounts payable Short Term Debt Other current Liabilities Total Current liabilities Non-Current liabilities Long-term debt Deferred Income Taxes Other Non-Current Liabilities Minority Interest Total Non-Current Liabilities Total Liabilities 221.3 222.3 0 0 2. 90 0 0 224.2 222.3 287.3 282 Shareholder's Equity Preferred Stock Equity Common Stock Equity Total equity Total liabilities and Stock Equity 0 56.6 56.6 343.9 0 58 58 340 2014 106.7 69.2 37.5 19.9 17.6 4.7 12.9 2013 85.7 55.5 30.2 16.8 13.4 3.7 9.7 -0.1 9.6 12.9 2.3 APEX MOLDING Income Statement (Value in $ millions) Sales Cost of Sales Gross Operating profit Selling, General & Admin. Expenses EBITDA Depreciation & Amortization EBIT Other Income, Net Total Income Avail for Interest Exp. Interest Expense Minority Interest Pre-Tax Income Income Taxes Special Income/Charges Net Income from Cont. Operations Net Income from Discont. Opers. Net Income from Total Operations Normalized Income Extraordinary Income Income from Cum. Eff of Acct. Chg. Income from Tax Loss Carry forward Other Gains Total Net Income 10.6 0 6.6 6.6 0 0.3 4.9 4.6 0 0 0 0 0 6.6 4.9 APEX MOLDING Annual Balance Sheets (Values in millions) 2014 2013 0.3 ASSETS Current Assets Cash and marketable securities Accounts receivable Inventory Other Current assets Total Current Assets 1.1 16.1 11.7 1.3 30.2 13 9.4 1.4 24.1 27.8 7.1 Non-Current Assets Property, Plant & Equipment, Gross Accumulated depreciation & Depletion Property, Plant & Equipment, Net Intangibles Other Non-Current Assets Total Non-Current Assets Total Assets 36.9 11.1 25.8 31.1 0.6 57.5 87.7 20.7 18.2 39.9 64 5.3 LIABILITIES AND EQUITIES Current Liabilities Accounts payable Short Term Debt Other current Liabilities Total Current liabilities 7.1 5.8 2.7 7.1 19.9 13.2 18.7 Non-Current liabilities Long-term debt Deferred Income Taxes Other Non-Current Liabilities Minority Interest Total Non-Current Liabilities Total Liabilities 3.9 3.9 32.4 22.6 35.8 0 Shareholder's Equity Preferred Stock Equity Common Stock Equity Total equity Total liabilities and Stock Equity 35.4 35.4 87.7 28.1 28.1 64