

Answered step by step
Verified Expert Solution
Question
1 Approved Answer
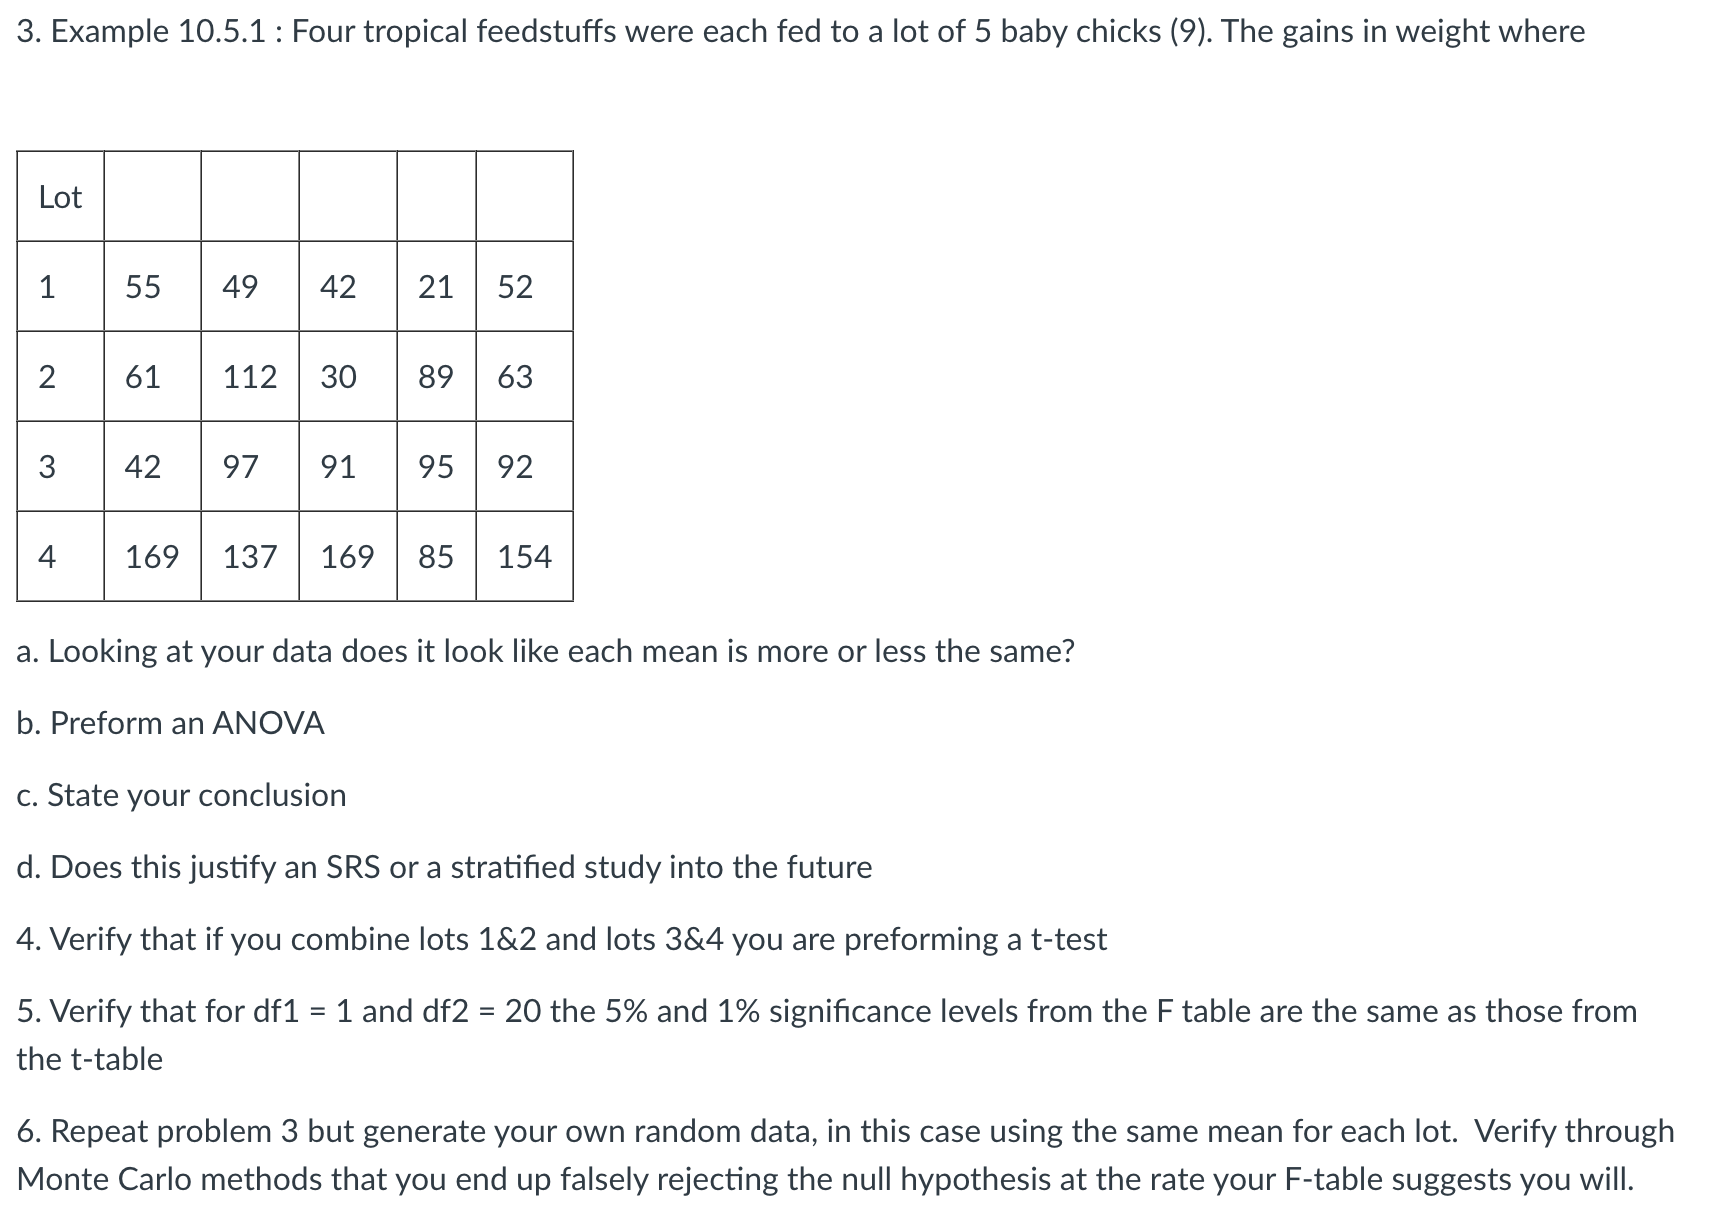
3. Example 10.5.1 : Four tropical feedstuffs were each fed to a lot of 5 baby chicks (9). The gains in weight where a. Looking
Step by Step Solution
There are 3 Steps involved in it
Step: 1

Get Instant Access to Expert-Tailored Solutions
See step-by-step solutions with expert insights and AI powered tools for academic success
Step: 2

Step: 3
Ace Your Homework with AI
Get the answers you need in no time with our AI-driven, step-by-step assistance
Get Started