

Answered step by step
Verified Expert Solution
Question
1 Approved Answer
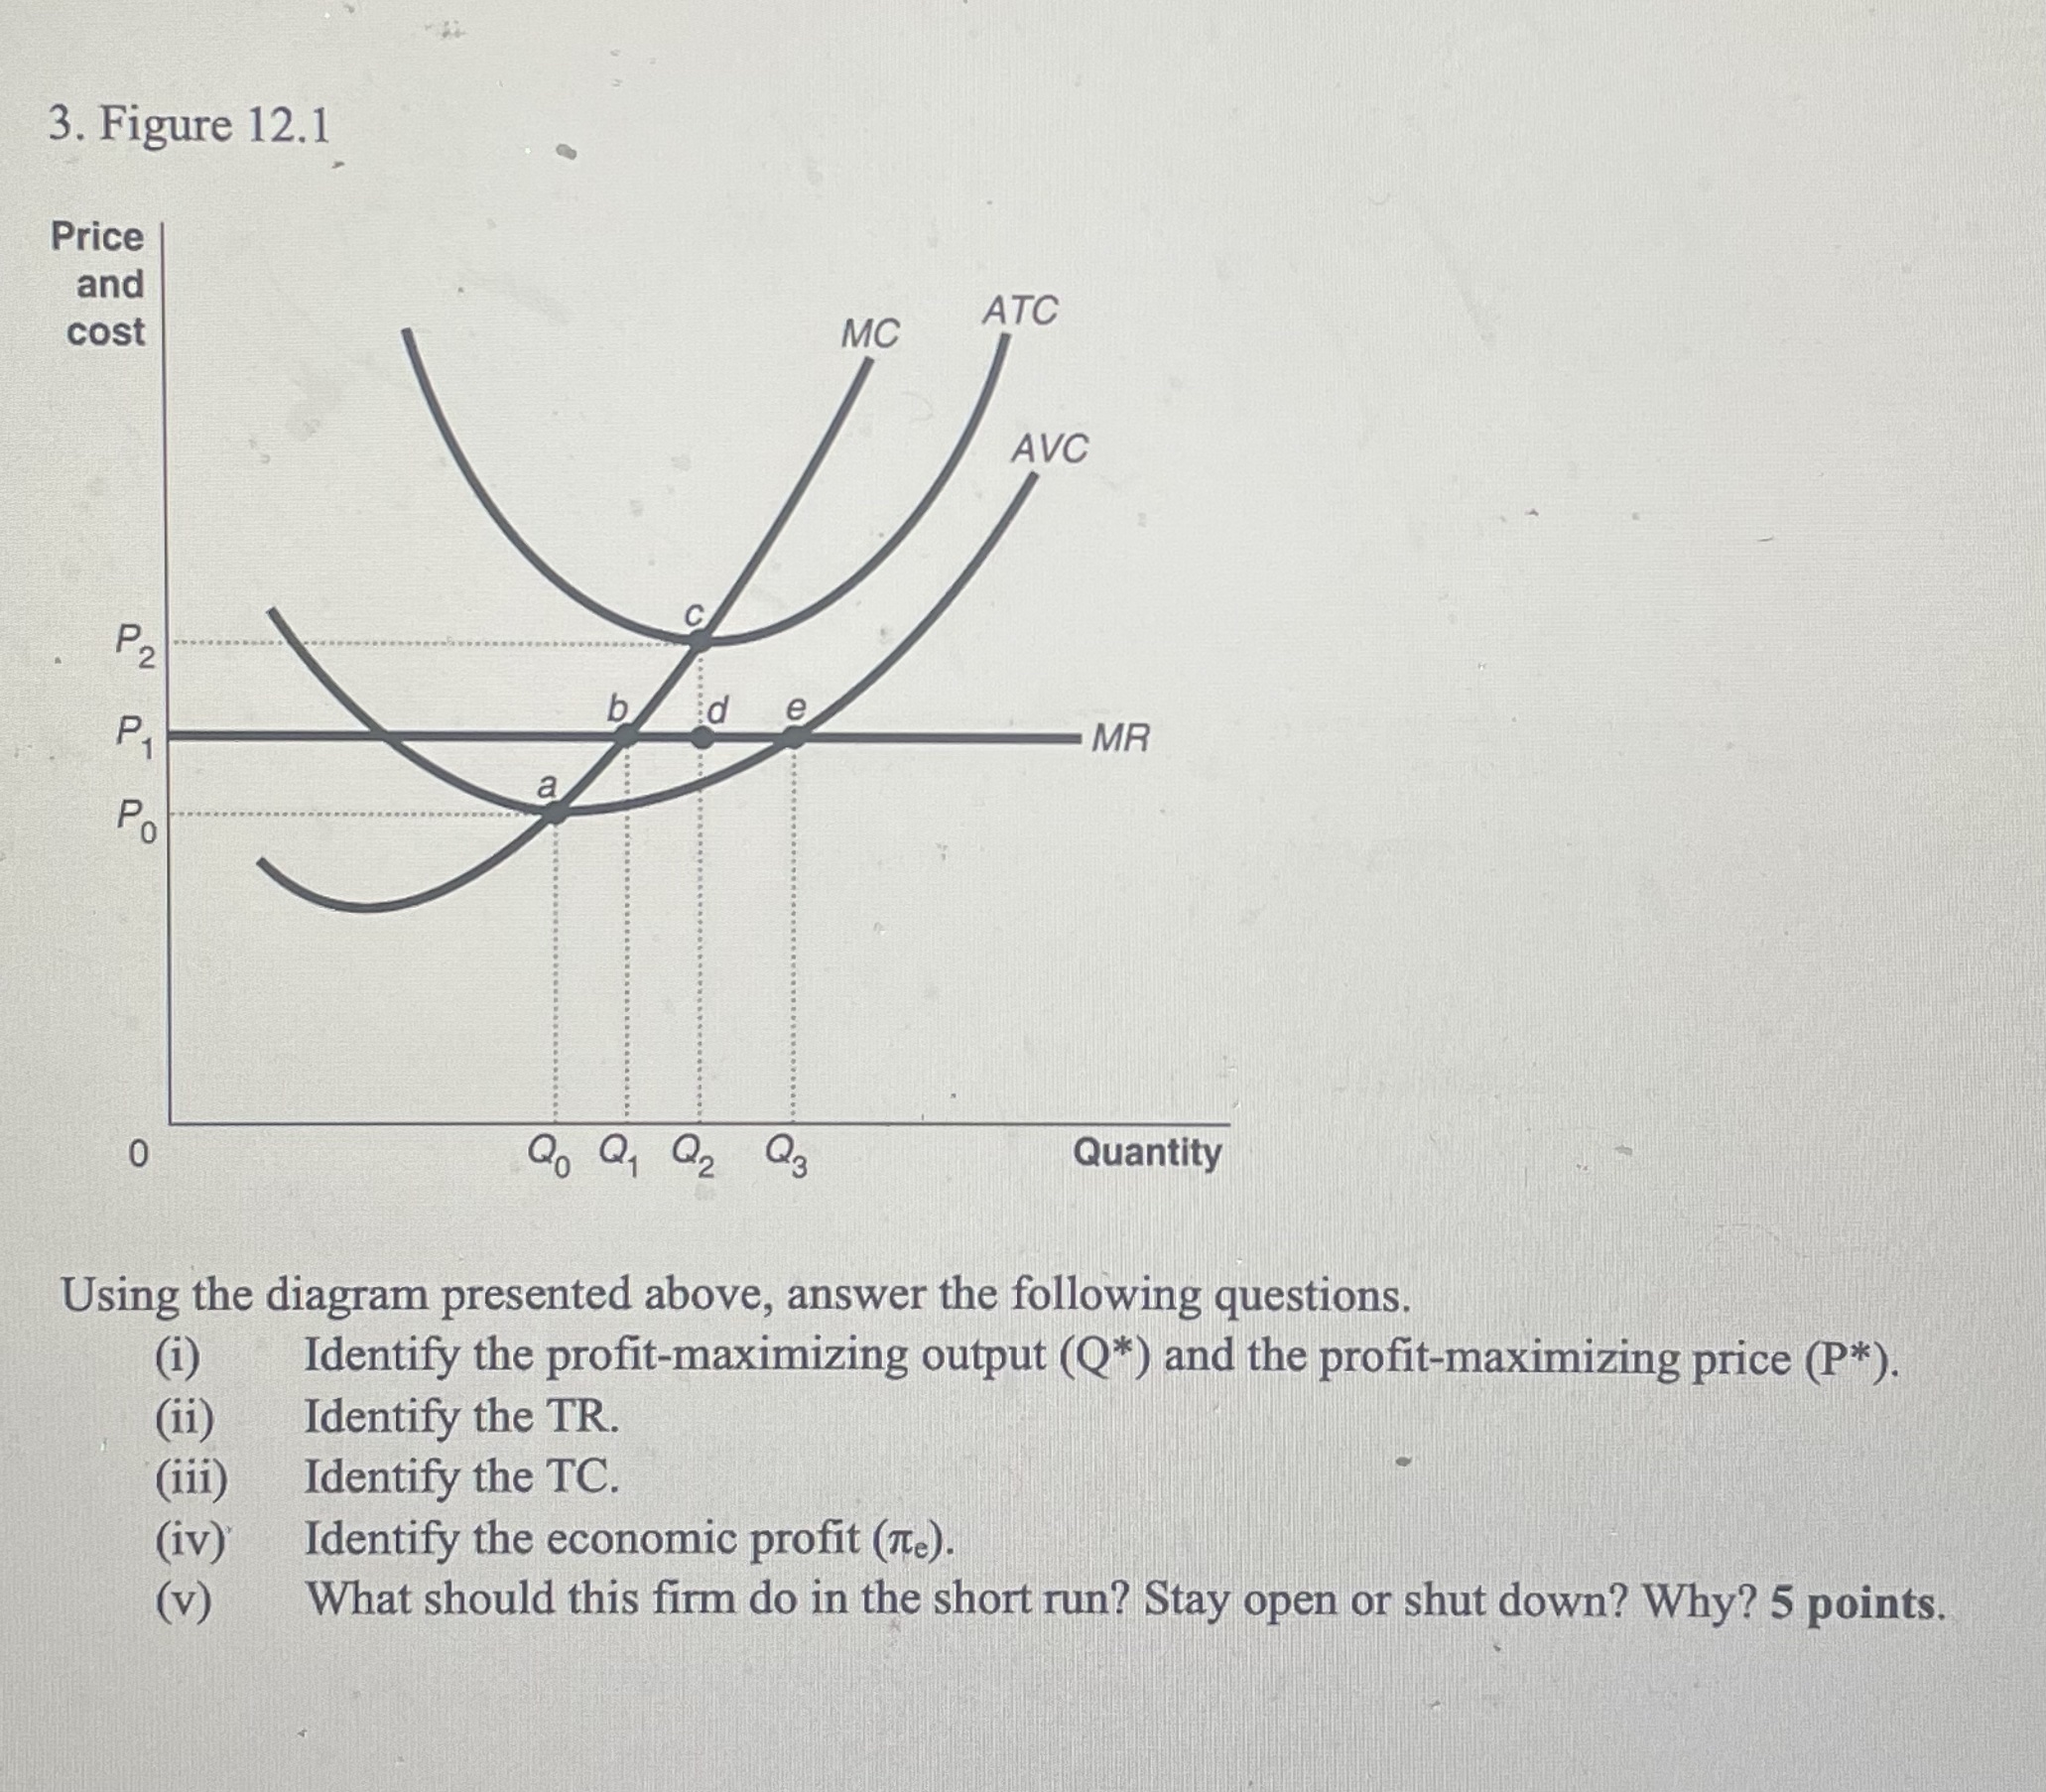
3. Figure 12.1 Price and ATC cost MC AVC P2 b e P1 MR a 20 Q Q2 23 Quantity Using the diagram presented above,
Step by Step Solution
There are 3 Steps involved in it
Step: 1

Get Instant Access to Expert-Tailored Solutions
See step-by-step solutions with expert insights and AI powered tools for academic success
Step: 2

Step: 3
Ace Your Homework with AI
Get the answers you need in no time with our AI-driven, step-by-step assistance
Get Started
Managerial Economics and Business Strategy
Authors: Michael R. baye
7th Edition
978-0073375960, 71267441, 73375969, 978-0071267441