Answered step by step
Verified Expert Solution
Question
1 Approved Answer
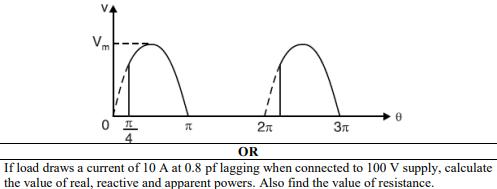
3. Find the average and effective values of the sinusoidal waveform shown in the following figure. The maximum value is 100 V. Vm 0
![]()

3. Find the average and effective values of the sinusoidal waveform shown in the following figure. The maximum value is 100 V. Vm 0 2 OR If load draws a current of 10 A at 0.8 pf lagging when connected to 100 V supply, calculate the value of real, reactive and apparent powers. Also find the value of resistance.
Step by Step Solution
There are 3 Steps involved in it
Step: 1
The detailed ...
Get Instant Access to Expert-Tailored Solutions
See step-by-step solutions with expert insights and AI powered tools for academic success
Step: 2

Step: 3

Ace Your Homework with AI
Get the answers you need in no time with our AI-driven, step-by-step assistance
Get Started


