Answered step by step
Verified Expert Solution
Question
1 Approved Answer
3. For a simple linear regression model with 20 observations which explains 75% of the variations in the dependent variable. source of variation regression
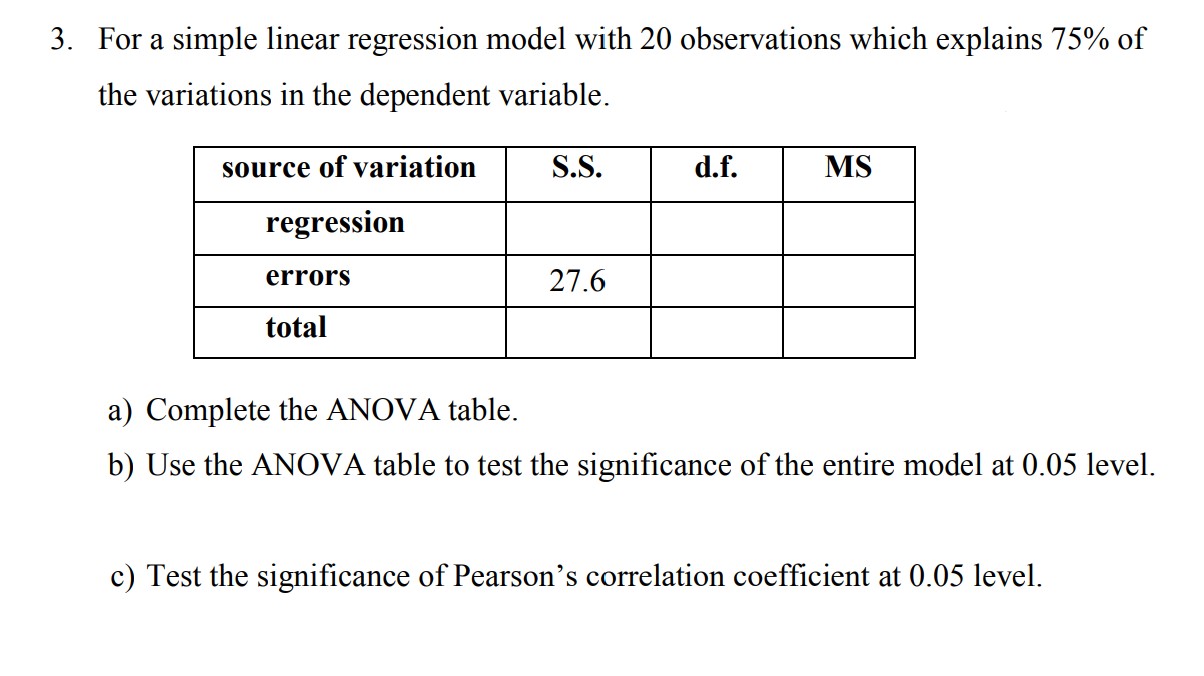
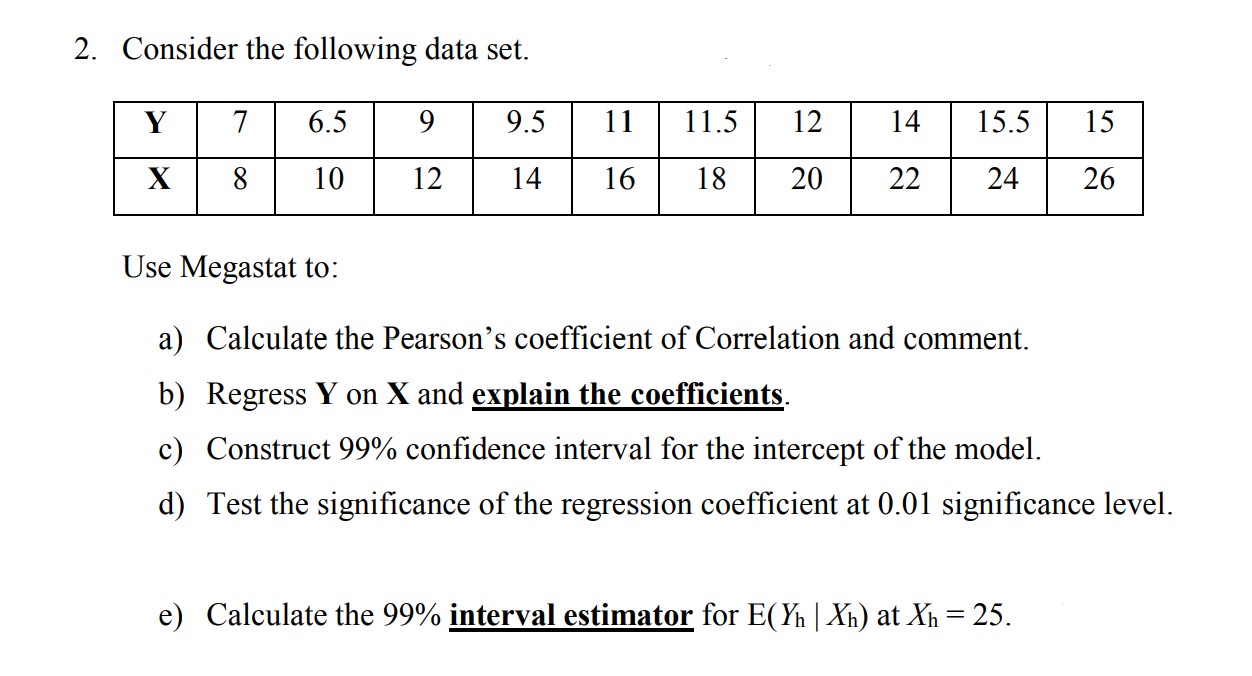

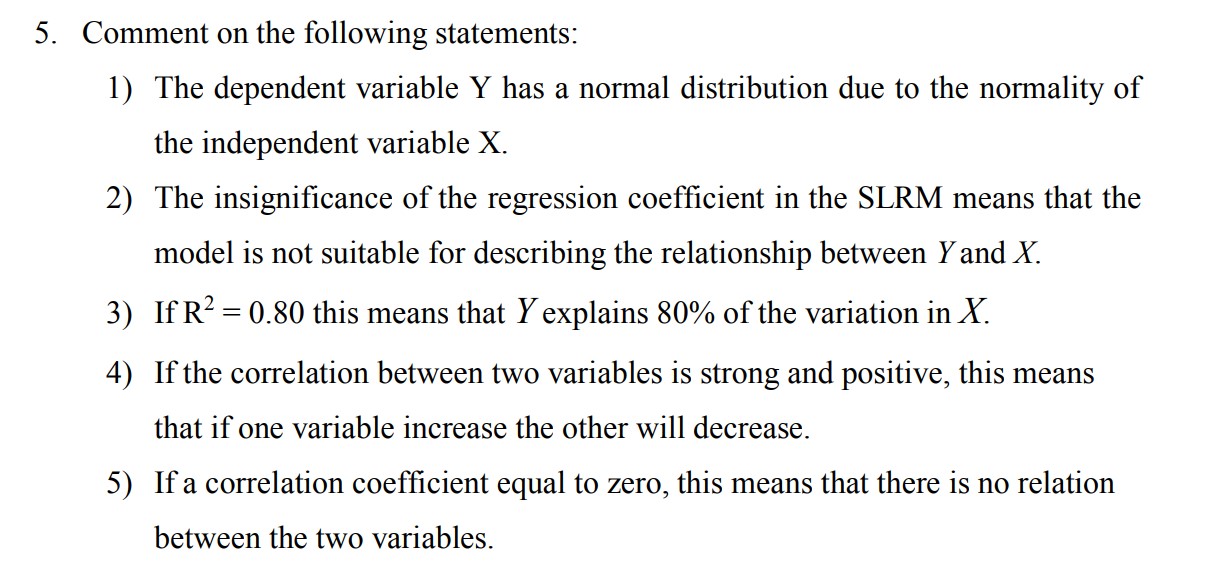
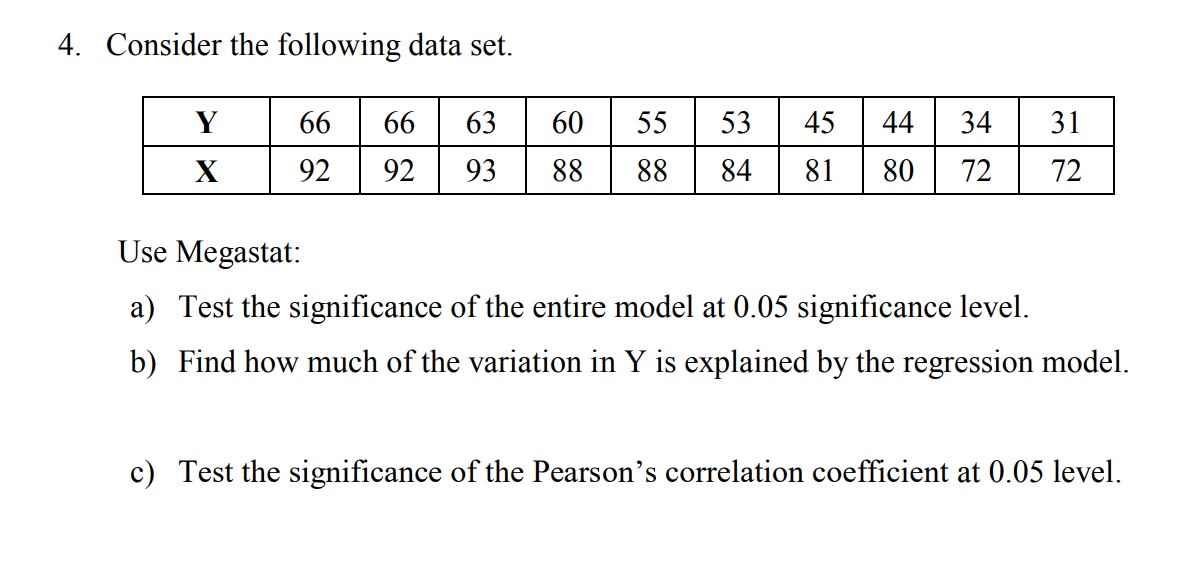
3. For a simple linear regression model with 20 observations which explains 75% of the variations in the dependent variable. source of variation regression errors total S.S. 27.6 d.f. MS a) Complete the ANOVA table. b) Use the ANOVA table to test the significance of the entire model at 0.05 level. c) Test the significance of Pearson's correlation coefficient at 0.05 level. 2. Consider the following data set. Y X 7 6.5 10 9 12 9.5 11 11.5 14 16 18 12 20 22 14 15.5 24 15 26 Use Megastat to: a) Calculate the Pearson's coefficient of Correlation and comment. b) Regress Y on X and explain the coefficients. c) Construct 99% confidence interval for the intercept of the model. d) Test the significance of the regression coefficient at 0.01 significance level. e) Calculate the 99% interval estimator for E(Y | Xh) at X = 25. 1. For the non-linear model: Y = Bo X3B1 a) Convert the model into a linear one. b) State the relation between the coefficients of the original model and the transformed model. 5. Comment on the following statements: 1) The dependent variable Y has a normal distribution due to the normality of the independent variable X. 2) The insignificance of the regression coefficient in the SLRM means that the model is not suitable for describing the relationship between Y and X. 3) If R = 0.80 this means that Y explains 80% of the variation in X. 4) If the correlation between two variables is strong and positive, this means that if one variable increase the other will decrease. 5) If a correlation coefficient equal to zero, this means that there is no relation between the two variables. 4. Consider the following data set. Y X 55 53 45 44 34 31 92 93 88 88 84 81 80 72 72 66 66 63 60 92 Use Megastat: a) Test the significance of the entire model at 0.05 significance level. b) Find how much of the variation in Y is explained by the regression model. c) Test the significance of the Pearson's correlation coefficient at 0.05 level.
Step by Step Solution
There are 3 Steps involved in it
Step: 1

Get Instant Access to Expert-Tailored Solutions
See step-by-step solutions with expert insights and AI powered tools for academic success
Step: 2

Step: 3

Ace Your Homework with AI
Get the answers you need in no time with our AI-driven, step-by-step assistance
Get Started


